
Portland Trail Blazers @ Houston Rockets

25-25, 8-17 Away
103
25-25, 8-17 Away
Final
| 1 | 2 | 3 | 4 | T | |
|---|---|---|---|---|---|
| 28 | 25 | 27 | 23 | 103 | |
HOU | 34 | 28 | 33 | 23 | 118 |

28-24, 18-8 Home
118
28-24, 18-8 Home
Game Leaders


Team Stats


45% (40-88)
Field Goal %
59% (47-79)
31% (8-26)
Three Point %
46% (12-26)
75% (15-20)
Free Throw %
75% (12-16)
11
Turnovers
11
45
Rebounds
44
Game Information
Houston, TX
Referee:Marc Davis
Referee:Sean Wright
Referee:Mark Ayotte
Team Stats
 | | |
|---|---|---|
| FG | 40-88 | 47-79 |
| Field Goal % | 45 | 59 |
| 3PT | 8-26 | 12-26 |
| Three Point % | 31 | 46 |
| FT | 15-20 | 12-16 |
| Free Throw % | 75 | 75 |
| Rebounds | 45 | 44 |
| Offensive Rebounds | 15 | 7 |
| Defensive Rebounds | 25 | 32 |
| Assists | 21 | 27 |
| Steals | 4 | 5 |
| Blocks | 4 | 9 |
| Total Turnovers | 11 | 11 |
| Points Conceded Off Turnovers | 13 | 15 |
| Fast Break Points | 3 | 14 |
| Points in Paint | 38 | 52 |
| Fouls | 12 | 19 |
| Technical Fouls | 0 | 2 |
| Flagrant Fouls | 0 | 0 |
Matchups
2025-26 Standings
Western Conference
| Northwest | W | L | PCT | GB | STRK |
|---|---|---|---|---|---|
| Oklahoma City | 64 | 18 | .780 | - | L2 |
| Denver | 54 | 28 | .659 | 10 | W12 |
| Minnesota | 49 | 33 | .598 | 15 | W2 |
| Portland | 42 | 40 | .512 | 22 | W2 |
| Utah | 22 | 60 | .268 | 42 | L1 |
| Southwest | W | L | PCT | GB | STRK |
|---|---|---|---|---|---|
| San Antonio | 62 | 20 | .756 | - | L1 |
| Houston | 52 | 30 | .634 | 10 | W1 |
| New Orleans | 26 | 56 | .317 | 36 | L2 |
| Dallas | 26 | 56 | .317 | 36 | W1 |
| Memphis | 25 | 57 | .305 | 37 | L8 |
NBA News
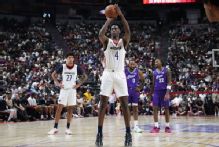
Wizards' Dybantsa outduels Jazz's Peterson in summer league debut
AJ Dybantsa, this year's No. 1 pick, led all players with 27 points to power the Wizards to a win over the Jazz and No. 2 pick Darryn Peterson.
6h
Sacramento Kings vs. LA Clippers: Game Highlights
Sacramento Kings vs. LA Clippers: Game Highlights
7h
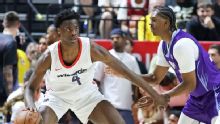
NBA summer league: Takeaways from Dybantsa's debut vs. Peterson
The NBA's top picks from the 2026 draft faced off at the Las Vegas summer league. How did AJ Dybantsa and Darryn Peterson fare?
6h