
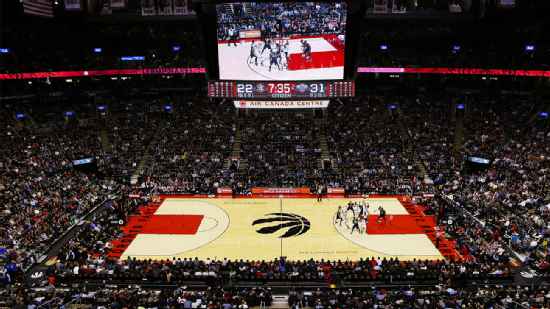
Cleveland Cavaliers @ Toronto Raptors
EASTERN CONFERENCE SEMIFINALS - GAME 3 • CLE leads series 3-0

51-31, 20-21 Away
115
51-31, 20-21 Away

51-31, 28-13 Home
94
51-31, 28-13 Home
Game Leaders


Team Stats


51% (39-76)
Field Goal %
44% (38-87)
57% (13-23)
Three Point %
11% (2-18)
86% (24-28)
Free Throw %
94% (16-17)
16
Turnovers
6
58
Rebounds
33
23
Largest Lead
5
Game Information
Toronto, ON
Referee:Bill Kennedy
Referee:Kane Fitzgerald
Referee:Mike Callahan
Team Stats
 | | |
|---|---|---|
| FG | 39-76 | 38-87 |
| Field Goal % | 51 | 44 |
| 3PT | 13-23 | 2-18 |
| Three Point % | 57 | 11 |
| FT | 24-28 | 16-17 |
| Free Throw % | 86 | 94 |
| Rebounds | 58 | 33 |
| Offensive Rebounds | 8 | 1 |
| Defensive Rebounds | 41 | 24 |
| Assists | 15 | 17 |
| Steals | 2 | 9 |
| Blocks | 7 | 4 |
| Total Turnovers | 16 | 6 |
| Points Conceded Off Turnovers | 11 | 3 |
| Fast Break Points | 5 | 6 |
| Points in Paint | 38 | 50 |
| Fouls | 20 | 21 |
| Technical Fouls | 0 | 1 |
| Flagrant Fouls | 0 | 0 |
| Largest Lead | 23 | 5 |
Matchups
2025-26 Standings
NBA News
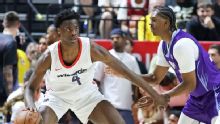
NBA summer league: Takeaways from Dybantsa debut vs. Peterson
The NBA's top picks from the 2026 draft faced off at Las Vegas summer league. How did AJ Dybantsa and Darryn Peterson fare?
7m
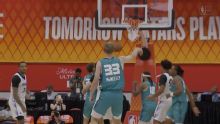
Charlotte Hornets vs. Orlando Magic: Game Highlights
Charlotte Hornets vs. Orlando Magic: Game Highlights
1h
Golden State Warriors vs. Dallas Mavericks: Game Highlights
Golden State Warriors vs. Dallas Mavericks: Game Highlights
2h