
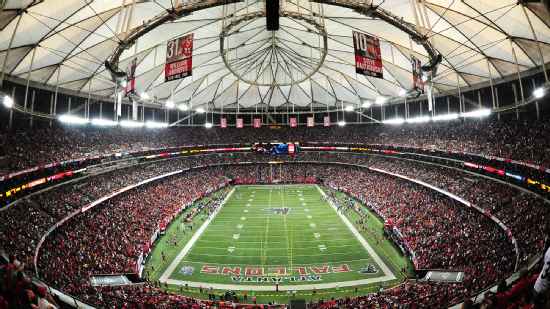
Philadelphia Eagles @ Atlanta Falcons

0-1, 0-1 Away
10
0-1, 0-1 Away

1-0, 1-0 Home
14
1-0, 1-0 Home
Game Leaders


Team Stats


301
Total Yards
319
3
Turnovers
3
18
1st Downs
18
8-55
Penalties
7-88
3/12
3rd Down
3/15
0/1
4th Down
1/1
0/1
Red Zone
0/3
26:09
Possession
33:51
Game Information
Atlanta, GA
Referee:Walt Coleman
Team Stats
 | | |
|---|---|---|
| 1st Downs | 18 | 18 |
| Passing 1st downs | 15 | 6 |
| Rushing 1st downs | 2 | 11 |
| 1st downs from penalties | 1 | 1 |
| 3rd down efficiency | 3-12 | 3-15 |
| 4th down efficiency | 0-1 | 1-1 |
| Total Plays | 61 | 67 |
| Total Yards | 301 | 319 |
| Total Drives | 13 | 14 |
| Yards per Play | 4.9 | 4.8 |
| Passing | 250 | 119 |
| Comp/Att | 24/45 | 12/23 |
| Yards per pass | 5.3 | 4.4 |
| Interceptions thrown | 1 | 1 |
| Sacks-Yards Lost | 2-7 | 4-37 |
| Rushing | 51 | 200 |
| Rushing Attempts | 14 | 40 |
| Yards per rush | 3.6 | 5.0 |
| Red Zone (Made-Att) | 0-1 | 0-3 |
| Penalties | 8-55 | 7-88 |
| Turnovers | 3 | 3 |
| Fumbles lost | 2 | 2 |
| Interceptions thrown | 1 | 1 |
| Defensive / Special Teams TDs | 0 | 0 |
| Possession | 26:09 | 33:51 |
2025 Standings
National Football Conference
| NFC East | W | L | T | PCT | PF | PA |
|---|---|---|---|---|---|---|
| Philadelphia | 11 | 6 | 0 | .647 | 379 | 325 |
| Dallas | 7 | 9 | 1 | .441 | 471 | 511 |
| Washington | 5 | 12 | 0 | .294 | 356 | 451 |
| New York | 4 | 13 | 0 | .235 | 381 | 439 |
| NFC South | W | L | T | PCT | PF | PA |
|---|---|---|---|---|---|---|
| Carolina | 8 | 9 | 0 | .471 | 311 | 380 |
| Tampa Bay | 8 | 9 | 0 | .471 | 380 | 411 |
| Atlanta | 8 | 9 | 0 | .471 | 353 | 401 |
| New Orleans | 6 | 11 | 0 | .353 | 306 | 383 |
NFL News

Buccaneers re-signing DT Rakeem Nunez-Roches, source says
The Buccaneers are re-signing defensive tackle Rakeem Nunez-Roches on a one-year deal, a source confirmed Friday.
1h
Gabe Jacas' NFL draft profile
Check out some of the top highlights from Illinois' Gabe Jacas.
2h
Garrett Nussmeier's NFL draft profile
Check out some of the top highlights from LSU's Garrett Nussmeier.
2h