
New York Giants @ New Orleans Saints

2-0, 1-0 Away
27
2-0, 1-0 Away

1-1, 0-1 Home
10
1-1, 0-1 Home
Game Leaders


165
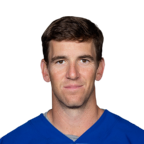
E. ManningQB
13/24, 1 TD
165

375
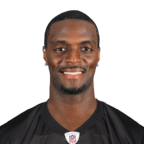
A. BrooksQB
27/45, 1 TD, 3 INT
375
83
T. BarberRB
22 CAR, 1 TD
83
47
D. McAllisterRB
15 CAR
47
64
P. BurressWR
5 REC
64
143
J. HornWR
9 REC, 1 TD
143
2
O. UmenyioraDE
2
--
--
9
A. PierceLB
9 SOLO
9
7
J. BellamyDB
5 SOLO
7
Team Stats


257
Total Yards
422
1
Turnovers
6
15
1st Downs
23
9-86
Penalties
13-92
5/12
3rd Down
8/15
0/0
4th Down
0/0
0/4
Red Zone
0/3
28:08
Possession
31:52
Game Information
East Rutherford, NJ
Referee:Ed Hochuli
Team Stats
 | | |
|---|---|---|
| 1st Downs | 15 | 23 |
| Passing 1st downs | 7 | 19 |
| Rushing 1st downs | 6 | 3 |
| 1st downs from penalties | 2 | 1 |
| 3rd down efficiency | 5-12 | 8-15 |
| 4th down efficiency | 0-0 | 0-0 |
| Total Plays | 53 | 71 |
| Total Yards | 257 | 422 |
| Total Drives | 12 | 10 |
| Yards per Play | 4.8 | 5.9 |
| Passing | 165 | 350 |
| Comp/Att | 13/24 | 27/45 |
| Yards per pass | 6.9 | 7.1 |
| Interceptions thrown | 0 | 3 |
| Sacks-Yards Lost | 0-0 | 4-25 |
| Rushing | 92 | 72 |
| Rushing Attempts | 29 | 22 |
| Yards per rush | 3.2 | 3.3 |
| Red Zone (Made-Att) | 0-4 | 0-3 |
| Penalties | 9-86 | 13-92 |
| Turnovers | 1 | 6 |
| Fumbles lost | 1 | 3 |
| Interceptions thrown | 0 | 3 |
| Defensive / Special Teams TDs | 0 | 0 |
| Possession | 28:08 | 31:52 |
2025 Standings
National Football Conference
| NFC East | W | L | T | PCT | PF | PA |
|---|---|---|---|---|---|---|
| Philadelphia | 11 | 6 | 0 | .647 | 379 | 325 |
| Dallas | 7 | 9 | 1 | .441 | 471 | 511 |
| Washington | 5 | 12 | 0 | .294 | 356 | 451 |
| New York | 4 | 13 | 0 | .235 | 381 | 439 |
| NFC South | W | L | T | PCT | PF | PA |
|---|---|---|---|---|---|---|
| Carolina | 8 | 9 | 0 | .471 | 311 | 380 |
| Tampa Bay | 8 | 9 | 0 | .471 | 380 | 411 |
| Atlanta | 8 | 9 | 0 | .471 | 353 | 401 |
| New Orleans | 6 | 11 | 0 | .353 | 306 | 383 |
NFL News
2026 NFL draft risers: Seven prospects climbing boards
Dillon Thieneman and Monroe Freeling have drastically boosted their stock since the start of last season. Who else has climbed the board?
2h
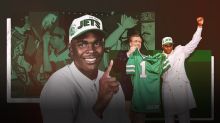
Why Keyshawn Johnson was the last WR to go No. 1, 30 years ago
The 1996 draft didn't produce a first-round QB, but the Jets found a playmaker with star power in Johnson.
3h
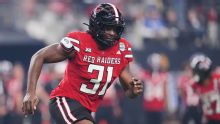
Will Jets get defensive at No. 2 with edge David Bailey?
The Jets have never taken a defensive player as high as No. 2, but Bailey is not an ordinary edge rusher.
3h