
Philadelphia Eagles @ Oakland Raiders

3-2, 1-1 Away
9
3-2, 1-1 Away

2-4, 1-2 Home
13
2-4, 1-2 Home
Game Leaders


Team Stats


283
Total Yards
325
0
Turnovers
2
14
1st Downs
18
4-38
Penalties
3-23
2/16
3rd Down
4/14
1/2
4th Down
0/1
0/1
Red Zone
0/1
26:58
Possession
33:02
Game Information
Oakland, CA
Referee:Pete Morelli
Team Stats
 | | |
|---|---|---|
| 1st Downs | 14 | 18 |
| Passing 1st downs | 9 | 7 |
| Rushing 1st downs | 3 | 8 |
| 1st downs from penalties | 2 | 3 |
| 3rd down efficiency | 2-16 | 4-14 |
| 4th down efficiency | 1-2 | 0-1 |
| Total Plays | 66 | 65 |
| Total Yards | 283 | 325 |
| Total Drives | 14 | 15 |
| Yards per Play | 4.3 | 5.0 |
| Passing | 216 | 209 |
| Comp/Att | 22/46 | 17/28 |
| Yards per pass | 4.2 | 7.0 |
| Interceptions thrown | 0 | 2 |
| Sacks-Yards Lost | 6-53 | 2-15 |
| Rushing | 67 | 116 |
| Rushing Attempts | 14 | 35 |
| Yards per rush | 4.8 | 3.3 |
| Red Zone (Made-Att) | 0-1 | 0-1 |
| Penalties | 4-38 | 3-23 |
| Turnovers | 0 | 2 |
| Fumbles lost | 0 | 0 |
| Interceptions thrown | 0 | 2 |
| Defensive / Special Teams TDs | 0 | 0 |
| Possession | 26:58 | 33:02 |
2025 Standings
National Football Conference
| NFC East | W | L | T | PCT | PF | PA |
|---|---|---|---|---|---|---|
| Philadelphia | 11 | 6 | 0 | .647 | 379 | 325 |
| Dallas | 7 | 9 | 1 | .441 | 471 | 511 |
| Washington | 5 | 12 | 0 | .294 | 356 | 451 |
| New York | 4 | 13 | 0 | .235 | 381 | 439 |
NFL News

Patrick Mahomes, Selena Gomez among celebrities at Taylor Swift-Travis Kelce wedding
A-list celebrities arrived in style to the couple's Madison Square Garden wedding festivities.
1h
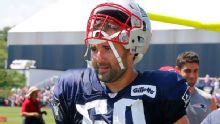
Predicting the next Ninkovich: Why these Pats have chance to surprise
Thinking about whether there could be another Rob Ninkovich story in Patriots camp in 2026.
9h
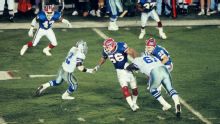
Emmitt Smith manifested rushing record long before first SB TD
The Cowboys legend was a 'goal setter' and that included aiming for the career rushing record as a rookie.
9h