
UTSA Roadrunners @ San Diego Toreros

2-8, 0-5 Away
69
2-8, 0-5 Away

7-4, 5-0 Home
78
7-4, 5-0 Home
Game Leaders


Team Stats


48% (28-58)
Field Goal %
49% (30-61)
13% (1-8)
Three Point %
40% (4-10)
67% (12-18)
Free Throw %
54% (14-26)
20
Turnovers
17
36
Rebounds
35
Game Information
San Diego, CA
Team Stats
 | | |
|---|---|---|
| FG | 28-58 | 30-61 |
| Field Goal % | 48 | 49 |
| 3PT | 1-8 | 4-10 |
| Three Point % | 13 | 40 |
| FT | 12-18 | 14-26 |
| Free Throw % | 67 | 54 |
| Rebounds | 36 | 35 |
| Offensive Rebounds | 11 | 14 |
| Defensive Rebounds | 25 | 21 |
| Assists | 6 | 18 |
| Steals | 10 | 13 |
| Blocks | 6 | 1 |
| Total Turnovers | 20 | 17 |
| Points Off Turnovers | 0 | 0 |
| Fast Break Points | 0 | 0 |
| Points in Paint | 0 | 0 |
| Fouls | 23 | 15 |
| Technical Fouls | 0 | 0 |
2025-26 Standings
NCAA Division I
| American Conference | CONF | GB | OVR |
|---|---|---|---|
| Rice | 10-0 | - | 20-3 |
| East Carolina | 10-2 | 1 | 18-7 |
| Tulsa | 8-3 | 2.5 | 16-7 |
| South Florida | 7-4 | 3.5 | 14-10 |
| North Texas | 7-4 | 3.5 | 13-10 |
| UTSA | 7-5 | 4 | 12-11 |
| Charlotte | 5-6 | 5.5 | 11-13 |
| Florida Atlantic | 5-7 | 6 | 11-13 |
| Temple | 4-7 | 6.5 | 10-13 |
| Tulane | 3-8 | 7.5 | 8-15 |
| UAB | 3-9 | 8 | 10-14 |
| Memphis | 2-8 | 8 | 8-15 |
| Wichita State | 2-10 | 9 | 5-20 |
| West Coast Conference | CONF | GB | OVR |
|---|---|---|---|
| Gonzaga | 10-2 | - | 18-7 |
| Oregon State | 9-3 | 1 | 17-8 |
| Loyola Marymount | 9-3 | 1 | 15-8 |
| Santa Clara | 8-4 | 2 | 18-7 |
| Portland | 8-4 | 2 | 14-10 |
| San Francisco | 7-6 | 3.5 | 14-10 |
| Pepperdine | 6-6 | 4 | 15-9 |
| Saint Mary's | 5-7 | 5 | 14-11 |
| Pacific | 4-8 | 6 | 9-14 |
| Washington State | 4-9 | 6.5 | 5-21 |
| San Diego | 3-10 | 7.5 | 9-17 |
| Seattle U | 1-12 | 9.5 | 5-19 |
Women's College Basketball News
Iowa State Cyclones vs. BYU Cougars: Game Highlights
Iowa State Cyclones vs. BYU Cougars: Game Highlights
2h
Oklahoma State Cowgirls vs. Kansas State Wildcats: Game Highlights
Oklahoma State Cowgirls vs. Kansas State Wildcats: Game Highlights
3h
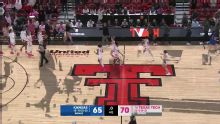
Bailey Maupin scores 23 and No. 16 Texas Tech women beat Kansas 70-65 for Krista Gerlich's 100th win
— Bailey Maupin scored 23 points, Snudda Collins added 17 off the bench and No. 16 Texas Tech beat Kansas 70-65 on Tuesday night for coach Krista Gerlich's 100th win with the Lady Raiders.
3h