
California Golden Bears @ Washington State Cougars

5-4, 1-4 Away
20
5-4, 1-4 Away
Final
| 1 | 2 | 3 | 4 | T | |
|---|---|---|---|---|---|
CAL | 0 | 7 | 7 | 6 | 20 |
| 0 | 10 | 3 | 0 | 13 |

1-9, 1-4 Home
13
1-9, 1-4 Home
Game Leaders


171
B. MansionQB
12/24, 2 INT
171
92
J. TuelQB
9/25
92
112
S. VereenRB
25 CAR, 2 TD
112
54
L. MitzRB
11 CAR, 1 TD
54
101
M. Jones Jr.WR
4 REC
101
50
M. WilsonWR
4 REC
50
2.5
T. GuytonDE
2.5
1
A. JustinCB
1
3
T. GuytonDE
3
1
A. JustinCB
1
Team Stats


383
Total Yards
194
2
Turnovers
0
20
1st Downs
10
5-38
Penalties
8-60
3/10
3rd Down
5/17
0/0
4th Down
1/1
19:10
Possession
16:50
Game Information
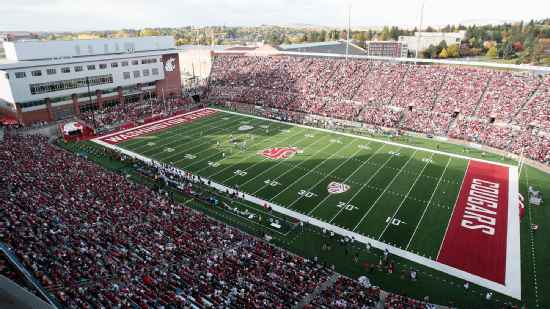
Pullman, WA
Team Stats
 | | |
|---|---|---|
| 1st Downs | 20 | 10 |
| 3rd down efficiency | 3-10 | 5-17 |
| 4th down efficiency | 0-0 | 1-1 |
| Total Yards | 383 | 194 |
| Passing | 189 | 131 |
| Comp/Att | 12/24 | 9/25 |
| Yards per pass | 7.1 | 3.7 |
| Interceptions thrown | 2 | 0 |
| Rushing | 212 | 102 |
| Rushing Attempts | 42 | 34 |
| Yards per rush | 5.0 | 3.0 |
| Penalties | 5-38 | 8-60 |
| Turnovers | 2 | 0 |
| Fumbles lost | 0 | 0 |
| Interceptions thrown | 2 | 0 |
| Possession | 19:10 | 16:50 |
2025 Standings
FBS
| Atlantic Coast Conference | CONF | OVR |
|---|---|---|
| Virginia | 7-1 | 11-3 |
| SMU | 6-2 | 9-4 |
| Miami | 6-2 | 13-3 |
| Pittsburgh | 6-2 | 8-5 |
| Georgia Tech | 6-2 | 9-4 |
| Duke | 6-2 | 9-5 |
| NC State | 4-4 | 8-5 |
| California | 4-4 | 7-6 |
| Clemson | 4-4 | 7-6 |
| Louisville | 4-4 | 9-4 |
| Wake Forest | 4-4 | 9-4 |
| Stanford | 3-5 | 4-8 |
| Florida State | 2-6 | 5-7 |
| North Carolina | 2-6 | 4-8 |
| Virginia Tech | 2-6 | 3-9 |
| Boston College | 1-7 | 2-10 |
| Syracuse | 1-7 | 3-9 |
| Pac-12 Conference | CONF | OVR |
|---|---|---|
| Washington State | 1-1 | 7-6 |
| Oregon State | 1-1 | 2-10 |
NCAAF News
2027 QB Gunner Rivers, son of Philip, commits to NC State
Four-star quarterback Gunner Rivers, son of NC State legend and eight-time NFL Pro Bowler Philip Rivers, has committed to the Wolfpack.
2h

2026 NFL draft Big Board rankings: Mel Kiper's top prospects
Mel Kiper Jr. is stacking the top 25 players for the NFL draft, starting with Fernando Mendoza. See who follows him as we hit the offseason.
5h

Why Louis Riddick considers Jeremiyah Love a massive difference-maker
Louis Riddick breaks down why Jeremiyah Love is the biggest offensive difference-maker in the 2026 NFL draft.
11h