
Central Arkansas Bears @ Tulsa Golden Hurricane

3-1, 1-1 Away
14
3-1, 1-1 Away
Final
| 1 | 2 | 3 | 4 | T | |
|---|---|---|---|---|---|
| 0 | 7 | 0 | 7 | 14 | |
TLSA | 7 | 17 | 3 | 14 | 41 |

2-2, 2-0 Home
41
2-2, 2-0 Home
Game Leaders


100
W. SmothersQB
7/18, 1 TD, 1 INT
100
232
G. KinneQB
22/33, 3 TD, 1 INT
232
61
J. HintonRB
10 CAR
61
93
A. SingletonRB
12 CAR
93
110
K. RobeyWR
7 REC
110
44
J. OwensWR
4 REC, 1 TD
44
--
--
1
O. RayDE
1
--
--
10
C. ArnickLB
3 SOLO
10
Team Stats


319
Total Yards
539
2
Turnovers
2
18
1st Downs
29
3-18
Penalties
5-55
3/12
3rd Down
6/14
0/1
4th Down
2/2
18:23
Possession
18:04
Game Information
Tulsa, OK
Team Stats
 | | |
|---|---|---|
| 1st Downs | 18 | 29 |
| 3rd down efficiency | 3-12 | 6-14 |
| 4th down efficiency | 0-1 | 2-2 |
| Total Yards | 319 | 539 |
| Passing | 191 | 262 |
| Comp/Att | 15/32 | 24/37 |
| Yards per pass | 5.7 | 6.9 |
| Interceptions thrown | 1 | 2 |
| Rushing | 136 | 282 |
| Rushing Attempts | 39 | 42 |
| Yards per rush | 3.5 | 6.7 |
| Penalties | 3-18 | 5-55 |
| Turnovers | 2 | 2 |
| Fumbles lost | 1 | 0 |
| Interceptions thrown | 1 | 2 |
| Possession | 18:23 | 18:04 |
2025 Standings
FCS
| United Athletic Conference | CONF | OVR |
|---|---|---|
| Abilene Christian | 7-1 | 9-5 |
| Tarleton State | 7-1 | 12-2 |
| Southern Utah | 6-2 | 7-5 |
| West Georgia | 5-3 | 8-3 |
| Austin Peay | 4-4 | 7-5 |
| Eastern Kentucky | 3-5 | 5-7 |
| Central Arkansas | 2-6 | 3-9 |
| Utah Tech | 1-7 | 2-10 |
| North Alabama | 1-7 | 2-10 |
FBS
| American Conference | CONF | OVR |
|---|---|---|
| Tulane | 7-1 | 11-3 |
| North Texas | 7-1 | 12-2 |
| Navy | 7-1 | 11-2 |
| East Carolina | 6-2 | 9-4 |
| South Florida | 6-2 | 9-4 |
| Army | 4-4 | 7-6 |
| Memphis | 4-4 | 8-5 |
| UTSA | 4-4 | 7-6 |
| Temple | 3-5 | 5-7 |
| Florida Atlantic | 3-5 | 4-8 |
| Rice | 2-6 | 5-8 |
| UAB | 2-6 | 4-8 |
| Tulsa | 1-7 | 4-8 |
| Charlotte | 0-8 | 1-11 |
NCAAF News

For college football's future, be careful to understand how it grew and succeeded
The sport's manifest destiny opened doors for Indiana and others. Consolidating power and access could eliminate the thrill of that growth.
3h
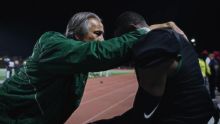
Why John Beam's legacy extends beyond the football field
Kimberley A. Martin reports on how football coach John Beam, who was killed in 2025, left an indelible mark beyond the football field.
1d
Sources: MAC to add Sacramento State as football-only member
The MAC presidents have voted to add FCS Sacramento State into the league as a football-only member starting in 2026, sources told ESPN.
1d