
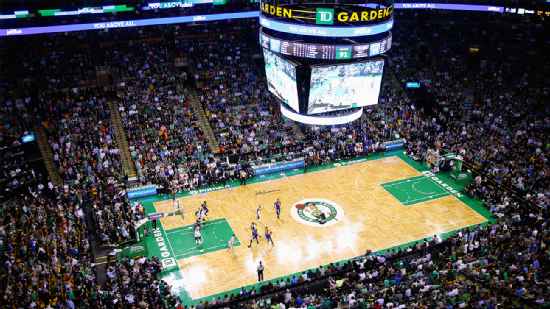
Los Angeles Clippers @ Boston Celtics

10-24, 3-15 Away
88
10-24, 3-15 Away

15-19, 13-6 Home
95
15-19, 13-6 Home

Los Angeles Clippers
starters |
bench |
team |
MIN | PTS | FG | 3PT | FT | REB | AST | TO | STL | BLK | OREB | DREB | PF | +/- |
| 42 | 26 | 10-21 | 4-7 | 2-2 | 9 | 2 | 2 | 0 | 2 | 2 | 7 | 5 | 0 |
| 43 | 22 | 10-19 | 0-0 | 2-4 | 12 | 2 | 4 | 0 | 1 | 2 | 10 | 3 | 0 |
| 44 | 8 | 4-9 | 0-0 | 0-0 | 15 | 1 | 1 | 1 | 4 | 4 | 11 | 4 | 0 |
| 27 | 0 | 0-4 | 0-0 | 0-0 | 4 | 4 | 2 | 0 | 0 | 0 | 4 | 2 | 0 |
| 38 | 18 | 7-14 | 0-4 | 4-5 | 3 | 2 | 6 | 2 | 0 | 0 | 3 | 3 | 0 |
MIN | PTS | FG | 3PT | FT | REB | AST | TO | STL | BLK | OREB | DREB | PF | +/- |
| 3 | 0 | 0-0 | 0-0 | 0-0 | 0 | 0 | 0 | 0 | 1 | 0 | 0 | 1 | 0 |
| 22 | 5 | 2-6 | 1-3 | 0-0 | 3 | 1 | 0 | 0 | 0 | 2 | 1 | 2 | 0 |
| 21 | 9 | 4-7 | 1-3 | 0-0 | 1 | 3 | 4 | 0 | 0 | 0 | 1 | 1 | 0 |
88 | 37-80 | 6-17 | 8-11 | 47 | 15 | 0 | 3 | 8 | 10 | 37 | 21 | ||
46% | 35% | 73% |
Boston Celtics
starters |
bench |
team |
MIN | PTS | FG | 3PT | FT | REB | AST | TO | STL | BLK | OREB | DREB | PF | +/- |
| 36 | 19 | 7-23 | 2-3 | 3-5 | 8 | 4 | 1 | 2 | 0 | 3 | 5 | 4 | 0 |
| 7 | 0 | 0-0 | 0-0 | 0-0 | 1 | 0 | 0 | 2 | 1 | 0 | 1 | 0 | 0 |
| 32 | 22 | 8-24 | 2-6 | 4-6 | 7 | 4 | 1 | 3 | 1 | 2 | 5 | 4 | 0 |
| 29 | 10 | 3-9 | 0-0 | 4-4 | 11 | 1 | 1 | 0 | 0 | 5 | 6 | 4 | 0 |
| 37 | 15 | 6-15 | 0-1 | 3-5 | 7 | 5 | 0 | 2 | 0 | 3 | 4 | 0 | 0 |
MIN | PTS | FG | 3PT | FT | REB | AST | TO | STL | BLK | OREB | DREB | PF | +/- |
| 23 | 7 | 2-4 | 1-1 | 2-2 | 1 | 1 | 2 | 1 | 0 | 0 | 1 | 0 | 0 |
| 10 | 2 | 1-2 | 0-0 | 0-0 | 3 | 0 | 2 | 0 | 0 | 1 | 2 | 0 | 0 |
| 14 | 9 | 3-4 | 0-0 | 3-4 | 5 | 1 | 0 | 0 | 0 | 3 | 2 | 1 | 0 |
| 12 | 0 | 0-3 | 0-1 | 0-0 | 2 | 2 | 0 | 1 | 1 | 0 | 2 | 1 | 0 |
| 1 | 0 | 0-0 | 0-0 | 0-0 | 0 | 0 | 0 | 0 | 0 | 0 | 0 | 0 | 0 |
| 39 | 11 | 5-9 | 1-2 | 0-0 | 1 | 3 | 0 | 1 | 0 | 0 | 1 | 2 | 0 |
95 | 35-93 | 6-14 | 19-26 | 46 | 21 | 0 | 12 | 3 | 17 | 29 | 16 | ||
38% | 43% | 73% |
+/- denotes team's net points while the player is on the court
Matchups


Game Information
Boston, MA
Referee:Bernie Fryer
Referee:Jim Kinsey
Referee:Derrick Stafford
2025-26 Standings
Eastern Conference
| Atlantic | W | L | PCT | GB | STRK |
|---|---|---|---|---|---|
| Boston | 56 | 26 | .683 | - | W2 |
| New York | 53 | 29 | .646 | 3 | L1 |
| Toronto | 46 | 36 | .561 | 10 | W1 |
| Philadelphia | 45 | 37 | .549 | 11 | W2 |
| Brooklyn | 20 | 62 | .244 | 36 | L3 |
NBA News
Denver Nuggets vs. Oklahoma City Thunder: Game Highlights
Denver Nuggets vs. Oklahoma City Thunder: Game Highlights
1h
Washington Wizards vs. Chicago Bulls: Game Highlights
Washington Wizards vs. Chicago Bulls: Game Highlights
2h
Memphis Grizzlies vs. Golden State Warriors: Game Highlights
Memphis Grizzlies vs. Golden State Warriors: Game Highlights
4h