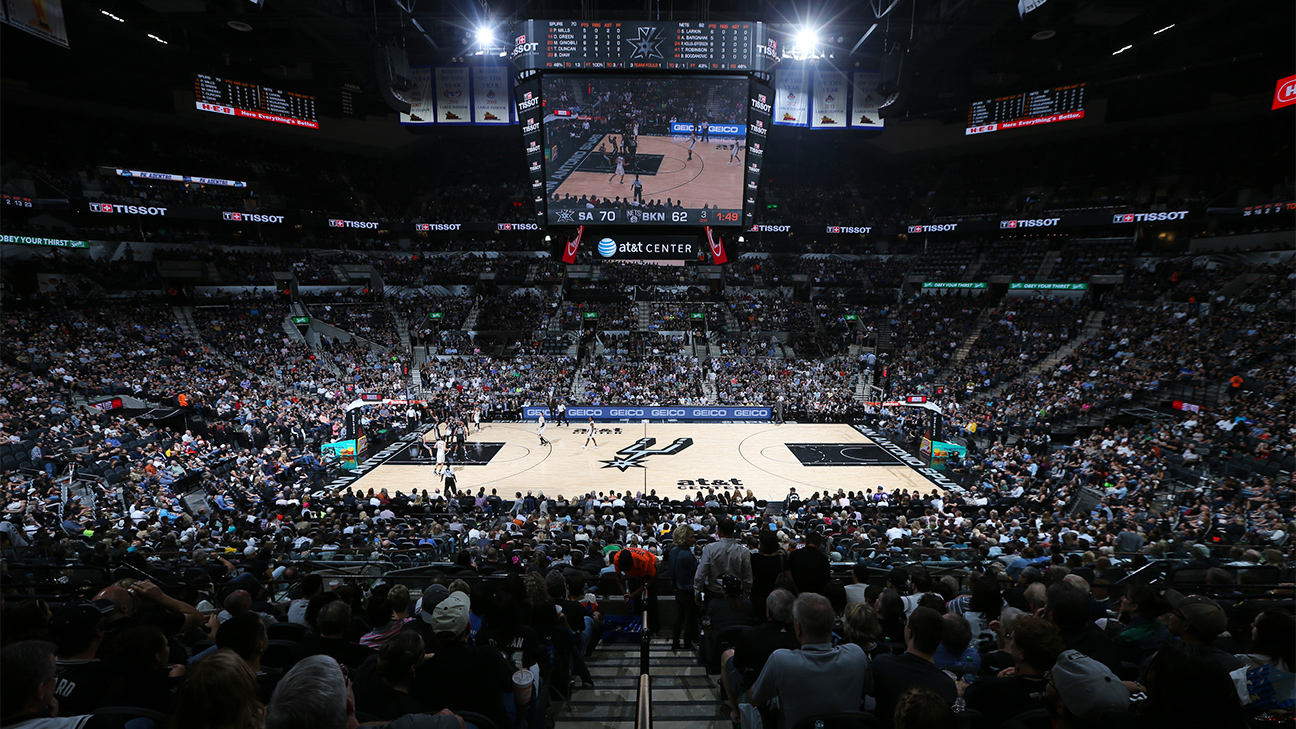
Seattle SuperSonics @ San Antonio Spurs
Game Leaders
Team Stats
42% (33-78)
Field Goal %
53% (38-72)
27% (4-15)
Three Point %
38% (5-13)
88% (21-24)
Free Throw %
77% (27-35)
34
Turnovers
22
46
Rebounds
44
2
Largest Lead
17
Game Information
San Antonio, TX

Referee:Joe Crawford
Referee:James Capers
Referee:Bob Delaney

Team Stats
| FG | 33-78 | 38-72 |
| Field Goal % | 42 | 53 |
| 3PT | 4-15 | 5-13 |
| Three Point % | 27 | 38 |
| FT | 21-24 | 27-35 |
| Free Throw % | 88 | 77 |
| Rebounds | 46 | 44 |
| Offensive Rebounds | 17 | 11 |
| Defensive Rebounds | 24 | 26 |
| Assists | 12 | 20 |
| Steals | 7 | 7 |
| Blocks | 4 | 7 |
| Total Turnovers | 34 | 22 |
| Points Conceded Off Turnovers | 11 | 22 |
| Fast Break Points | 8 | 22 |
| Points in Paint | -1 | -1 |
| Fouls | 30 | 26 |
| Technical Fouls | 0 | 0 |
| Flagrant Fouls | 0 | 0 |
| Largest Lead | 2 | 17 |
Matchups
2025-26 Standings
Western Conference
| Southwest | W | L | PCT | GB | STRK |
|---|---|---|---|---|---|
| San Antonio | 34 | 16 | .680 | - | W2 |
| Houston | 31 | 18 | .633 | 2.5 | L1 |
| Memphis | 20 | 29 | .408 | 13.5 | W2 |
| Dallas | 19 | 31 | .380 | 15 | L5 |
| New Orleans | 13 | 40 | .245 | 22.5 | L3 |
NBA News

Sources: Lakers get shooting help, trade for Hawks' Luke Kennard
The Lakers have acquired guard Luke Kennard from the Hawks in exchange for guard Gabe Vincent and a 2032 second-round pick, sources told ESPN's Shams Charania on Thursday.
2h

NBA trade tracker: Details for every deal of the 2025-26 season
Here's every trade of the 2025-26 season, including the Mavericks trading Anthony Davis to the Wizards.
2h

NBA buzz: Live updates, trades, rumors, intel on deadline day
Catch up on what we're hearing before the 3 p.m. ET trade deadline, with updates on Ivica Zubac, Giannis Antetokounmpo and more.
3h
GAMBLING PROBLEM? CALL 1-800-GAMBLER, (800) 327-5050 or visit gamblinghelplinema.org (MA). Call 877-8-HOPENY/text HOPENY (467369) (NY). Please Gamble Responsibly. 888-789-7777/visit ccpg.org (CT), or visit www.mdgamblinghelp.org (MD). 21+ and present in most states. (18+ DC/KY/NH/WY). Void in ONT/OR/NH. Eligibility restrictions apply. On behalf of Boot Hill Casino & Resort (KS). Terms: sportsbook.draftkings.com/promos.
Copyright: © 2026 ESPN Enterprises, Inc. All rights reserved.


