
Los Angeles Lakers @ Milwaukee Bucks

9-2, 3-1 Away
118
9-2, 3-1 Away

5-6, 3-3 Home
107
5-6, 3-3 Home
Game Leaders


Team Stats


54% (42-78)
Field Goal %
46% (41-89)
63% (10-16)
Three Point %
38% (9-24)
83% (24-29)
Free Throw %
59% (16-27)
13
Turnovers
13
45
Rebounds
55
14
Largest Lead
7
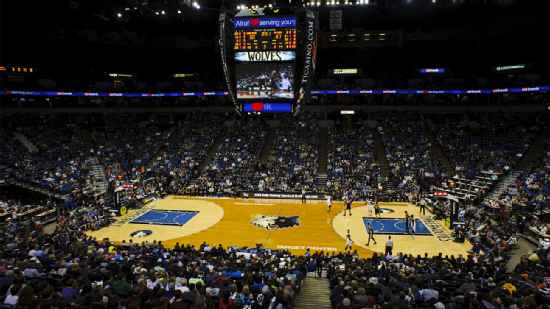
Game Information
Minneapolis, MN
Team Stats
 | | |
|---|---|---|
| FG | 42-78 | 41-89 |
| Field Goal % | 54 | 46 |
| 3PT | 10-16 | 9-24 |
| Three Point % | 63 | 38 |
| FT | 24-29 | 16-27 |
| Free Throw % | 83 | 59 |
| Rebounds | 45 | 55 |
| Offensive Rebounds | 8 | 19 |
| Defensive Rebounds | 32 | 28 |
| Assists | 24 | 22 |
| Steals | 9 | 6 |
| Blocks | 4 | 7 |
| Total Turnovers | 13 | 13 |
| Points Conceded Off Turnovers | 20 | 11 |
| Fast Break Points | 18 | 16 |
| Points in Paint | 44 | 34 |
| Fouls | 20 | 23 |
| Technical Fouls | 1 | 1 |
| Flagrant Fouls | 1 | 0 |
| Largest Lead | 14 | 7 |
Matchups
2025-26 Standings
Western Conference
| Pacific | W | L | PCT | GB | STRK |
|---|---|---|---|---|---|
| LA Lakers | 53 | 29 | .646 | - | W3 |
| Phoenix | 45 | 37 | .549 | 8 | W1 |
| LA Clippers | 42 | 40 | .512 | 11 | W1 |
| Golden State | 37 | 45 | .451 | 16 | L3 |
| Sacramento | 22 | 60 | .268 | 31 | L1 |
NBA News
Ex-NBA star Lamar Odom plans to plead no-contest in DUI case
Former NBA star Lamar Odom, 46, is expected to plead no-contest to reduce a DUI charge he received in January to reckless driving.
3h
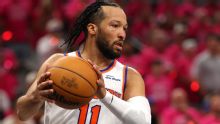
Sources: Knicks' Jalen Brunson has surgery on left wrist
Knicks guard Jalen Brunson had surgery on his left wrist, and the Finals MVP is expected to return to basketball activities later this summer, sources told ESPN.
5h
2026 NBA buzz: Latest free agency and trade updates
We're tracking deals, trades and buzz across the NBA, including Donovan Mitchell agreeing to an extension with the Cavs.
6h