Arizona Cardinals @ Washington Redskins
Game Leaders
Team Stats
313
Total Yards
323
2
Turnovers
0
19
1st Downs
21
6-42
Penalties
7-67
5/11
3rd Down
5/11
0/0
4th Down
0/0
1/2
Red Zone
3/3
26:55
Possession
33:05
Game Information
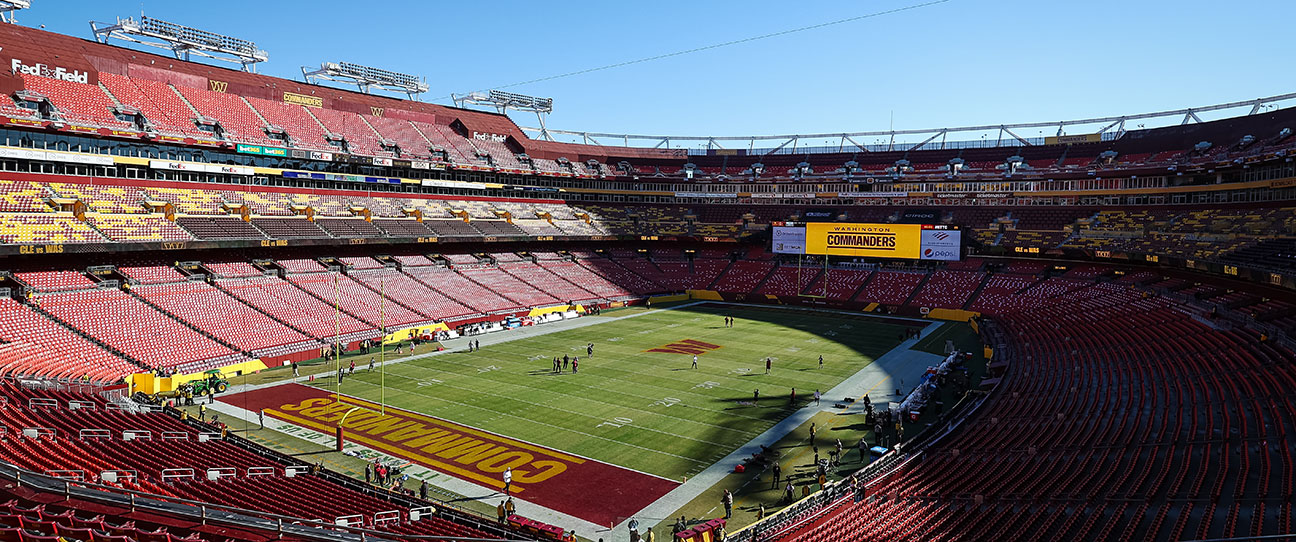
Landover, MD

1st Quarter
Touchdown
8:33 - 1st
0
ARI
6
WSH
TD
11 plays, 60 yards, 6:32
Extra Point
8:28 - 1st
0
ARI
7
WSH
PAT
11 plays, 60 yards, 6:32
2nd Quarter
Field Goal
13:13 - 2nd
0
ARI
10
WSH
Field Goal
4 plays, 4 yards, 1:52
Touchdown
2:47 - 2nd
6
ARI
10
WSH
TD
11 plays, 80 yards, 6:20
Extra Point
2:43 - 2nd
7
ARI
10
WSH
PAT
11 plays, 80 yards, 6:20
3rd Quarter
Field Goal
9:25 - 3rd
10
ARI
10
WSH
Field Goal
15 plays, 50 yards, 5:40
Touchdown
3:21 - 3rd
10
ARI
16
WSH
TD
11 plays, 79 yards, 6:04
Extra Point
3:16 - 3rd
10
ARI
17
WSH
PAT
11 plays, 79 yards, 6:04
Touchdown
2:03 - 3rd
16
ARI
17
WSH
TD
3 plays, 85 yards, 1:23
Extra Point
1:53 - 3rd
17
ARI
17
WSH
PAT
3 plays, 85 yards, 1:23
4th Quarter
Touchdown
12:18 - 4th
17
ARI
23
WSH
TD
2 plays, 15 yards, 0:48
Extra Point
12:10 - 4th
17
ARI
24
WSH
PAT
2 plays, 15 yards, 0:48
Data is currently unavailable.
2025 Standings
National Football Conference
| NFC West | W | L | T | PCT | PF | PA |
|---|---|---|---|---|---|---|
| Seattle | 14 | 3 | 0 | .824 | 483 | 292 |
| Los Angeles | 12 | 5 | 0 | .706 | 518 | 346 |
| San Francisco | 12 | 5 | 0 | .706 | 437 | 371 |
| Arizona | 3 | 14 | 0 | .176 | 355 | 488 |
NFL News

Super Bowl 2026: Patriots-Seahawks live updates, highlights and analysis
Live updates, highlights, scene, insight from Super Bowl LX at Levi's Stadium.
2h

Super Bowl history: Facts, stats and records to know
Here is a look at Super Bowl records such as most points, most touchdowns and Tom Brady's all-time totals.
2h

Puppy Bowl 2026 features NFL-inspired pups
Before the Seahawks and Patriots clash in Super Bowl LX, Barker Playfield, Josh Howlin and more took the field for Puppy Bowl XXII.
3h
GAMBLING PROBLEM? CALL 1-800-GAMBLER, (800) 327-5050 or visit gamblinghelplinema.org (MA). Call 877-8-HOPENY/text HOPENY (467369) (NY). Please Gamble Responsibly. 888-789-7777/visit ccpg.org (CT), or visit www.mdgamblinghelp.org (MD). 21+ and present in most states. (18+ DC/KY/NH/WY). Void in ONT/OR/NH. Eligibility restrictions apply. On behalf of Boot Hill Casino & Resort (KS). Terms: sportsbook.draftkings.com/promos.
Copyright: © 2026 ESPN Enterprises, Inc. All rights reserved.


