
Seattle Seahawks @ San Francisco 49ers

6-4, 2-3 Away
14
6-4, 2-3 Away

5-5, 4-2 Home
20
5-5, 4-2 Home
Game Leaders


Team Stats


303
Total Yards
416
5
Turnovers
1
15
1st Downs
18
5-30
Penalties
5-39
1/8
3rd Down
3/13
0/2
4th Down
0/0
0/0
Red Zone
2/5
23:48
Possession
36:12
Game Information
San Francisco, CA
Referee:Larry Nemmers
Team Stats
 | | |
|---|---|---|
| 1st Downs | 15 | 18 |
| Passing 1st downs | 7 | 7 |
| Rushing 1st downs | 7 | 10 |
| 1st downs from penalties | 1 | 1 |
| 3rd down efficiency | 1-8 | 3-13 |
| 4th down efficiency | 0-2 | 0-0 |
| Total Plays | 54 | 60 |
| Total Yards | 303 | 416 |
| Total Drives | 13 | 13 |
| Yards per Play | 5.6 | 6.9 |
| Passing | 233 | 154 |
| Comp/Att | 19/31 | 19/25 |
| Yards per pass | 7.1 | 5.9 |
| Interceptions thrown | 3 | 0 |
| Sacks-Yards Lost | 2-19 | 1-9 |
| Rushing | 70 | 262 |
| Rushing Attempts | 21 | 34 |
| Yards per rush | 3.3 | 7.7 |
| Red Zone (Made-Att) | 0-0 | 2-5 |
| Penalties | 5-30 | 5-39 |
| Turnovers | 5 | 1 |
| Fumbles lost | 2 | 1 |
| Interceptions thrown | 3 | 0 |
| Defensive / Special Teams TDs | 0 | 0 |
| Possession | 23:48 | 36:12 |
2025 Standings
National Football Conference
| NFC West | W | L | T | PCT | PF | PA |
|---|---|---|---|---|---|---|
| Seattle | 14 | 3 | 0 | .824 | 483 | 292 |
| Los Angeles | 12 | 5 | 0 | .706 | 518 | 346 |
| San Francisco | 12 | 5 | 0 | .706 | 437 | 371 |
| Arizona | 3 | 14 | 0 | .176 | 355 | 488 |
NFL News

2026 NFL draft: Latest Dallas Cowboys updates, intel, buzz
The Cowboys have eight picks, two in Round 1. Here's the latest on what Dallas might do in the 2026 NFL draft.
4h
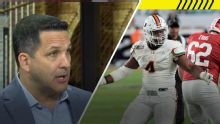
Schefter explains how teams will evaluate Rueben Bain Jr.
Adam Schefter reports on Rueben Bain Jr.'s involvement in a 2024 auto accident and how NFL teams are now evaluating the star edge rusher.
5h

2026 NFL draft: Which teams should trade up, down in Round 1?
Would it make sense for the Eagles, Bears and Chiefs to trade up in Round 1? Should the Cowboys and Lions try to move down the board? Here's our advice for 10 teams.
6h