
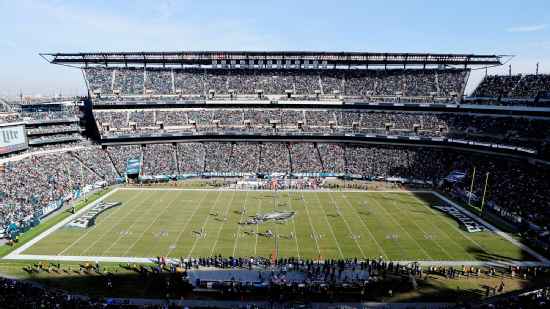
Carolina Panthers @ Philadelphia Eagles

6-6, 2-4 Away
24
6-6, 2-4 Away

6-6, 4-3 Home
27
6-6, 4-3 Home
Game Leaders


Team Stats


377
Total Yards
402
2
Turnovers
0
18
1st Downs
18
7-67
Penalties
8-72
4/13
3rd Down
7/17
0/0
4th Down
0/0
2/3
Red Zone
1/3
27:37
Possession
32:23
Game Information
Philadelphia, PA
Referee:Walt Anderson
Team Stats
 | | |
|---|---|---|
| 1st Downs | 18 | 18 |
| Passing 1st downs | 10 | 12 |
| Rushing 1st downs | 6 | 5 |
| 1st downs from penalties | 2 | 1 |
| 3rd down efficiency | 4-13 | 7-17 |
| 4th down efficiency | 0-0 | 0-0 |
| Total Plays | 60 | 67 |
| Total Yards | 377 | 402 |
| Total Drives | 14 | 13 |
| Yards per Play | 6.3 | 6.0 |
| Passing | 269 | 304 |
| Comp/Att | 22/37 | 21/39 |
| Yards per pass | 7.3 | 7.6 |
| Interceptions thrown | 2 | 0 |
| Sacks-Yards Lost | 0-0 | 1-8 |
| Rushing | 108 | 98 |
| Rushing Attempts | 23 | 27 |
| Yards per rush | 4.7 | 3.6 |
| Red Zone (Made-Att) | 2-3 | 1-3 |
| Penalties | 7-67 | 8-72 |
| Turnovers | 2 | 0 |
| Fumbles lost | 0 | 0 |
| Interceptions thrown | 2 | 0 |
| Defensive / Special Teams TDs | 0 | 0 |
| Possession | 27:37 | 32:23 |
2025 Standings
National Football Conference
| NFC South | W | L | T | PCT | PF | PA |
|---|---|---|---|---|---|---|
| Carolina | 8 | 9 | 0 | .471 | 311 | 380 |
| Tampa Bay | 8 | 9 | 0 | .471 | 380 | 411 |
| Atlanta | 8 | 9 | 0 | .471 | 353 | 401 |
| New Orleans | 6 | 11 | 0 | .353 | 306 | 383 |
| NFC East | W | L | T | PCT | PF | PA |
|---|---|---|---|---|---|---|
| Philadelphia | 11 | 6 | 0 | .647 | 379 | 325 |
| Dallas | 7 | 9 | 1 | .441 | 471 | 511 |
| Washington | 5 | 12 | 0 | .294 | 356 | 451 |
| New York | 4 | 13 | 0 | .235 | 381 | 439 |
NFL News
Former Jets quarterback Browning Nagle dies at age 57
Former Jets quarterback Browning Nagle has died at age 57.
1h

Broncos owners purchase around 40% of Rockies, per reports
The Rockies are bringing in Broncos owners Greg Penner and Carrie Walton Penner through a minority investment, with multiple reports saying they are purchasing about 40% of the team.
1h

What the DOJ's NFL investigation could mean for networks, fans
What could the federal government's investigation of the NFL mean for fans and television networks?
2h