
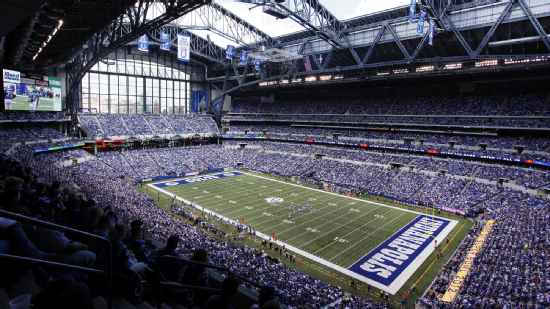
Cleveland Browns @ Indianapolis Colts

1-1, 1-0 Away
27
1-1, 1-0 Away

0-2, 0-1 Home
19
0-2, 0-1 Home
Game Leaders


Team Stats


303
Total Yards
285
1
Turnovers
2
18
1st Downs
19
3-49
Penalties
4-21
8/16
3rd Down
4/14
1/1
4th Down
0/0
2/4
Red Zone
1/3
34:34
Possession
25:26
Game Information
Indianapolis, IN
Referee:Gene Steratore
Team Stats
 | | |
|---|---|---|
| 1st Downs | 18 | 19 |
| Passing 1st downs | 9 | 12 |
| Rushing 1st downs | 8 | 6 |
| 1st downs from penalties | 1 | 1 |
| 3rd down efficiency | 8-16 | 4-14 |
| 4th down efficiency | 1-1 | 0-0 |
| Total Plays | 67 | 66 |
| Total Yards | 303 | 285 |
| Total Drives | 12 | 12 |
| Yards per Play | 4.5 | 4.3 |
| Passing | 197 | 176 |
| Comp/Att | 22/32 | 19/38 |
| Yards per pass | 6.0 | 4.4 |
| Interceptions thrown | 0 | 1 |
| Sacks-Yards Lost | 1-14 | 2-15 |
| Rushing | 106 | 109 |
| Rushing Attempts | 34 | 26 |
| Yards per rush | 3.1 | 4.2 |
| Red Zone (Made-Att) | 2-4 | 1-3 |
| Penalties | 3-49 | 4-21 |
| Turnovers | 1 | 2 |
| Fumbles lost | 1 | 1 |
| Interceptions thrown | 0 | 1 |
| Defensive / Special Teams TDs | 0 | 0 |
| Possession | 34:34 | 25:26 |
2025 Standings
American Football Conference
| AFC North | W | L | T | PCT | PF | PA |
|---|---|---|---|---|---|---|
| Pittsburgh | 10 | 7 | 0 | .588 | 397 | 387 |
| Baltimore | 8 | 9 | 0 | .471 | 424 | 398 |
| Cincinnati | 6 | 11 | 0 | .353 | 414 | 492 |
| Cleveland | 5 | 12 | 0 | .294 | 279 | 379 |
| AFC South | W | L | T | PCT | PF | PA |
|---|---|---|---|---|---|---|
| Jacksonville | 13 | 4 | 0 | .765 | 474 | 336 |
| Houston | 12 | 5 | 0 | .706 | 404 | 295 |
| Indianapolis | 8 | 9 | 0 | .471 | 466 | 412 |
| Tennessee | 3 | 14 | 0 | .176 | 284 | 478 |
NFL News

Does DeVonta Smith have what it takes to replace A.J. Brown's production?
Does DeVonta Smith have what it takes to replace A.J. Brown's production?
3h

Why Riddick has lower expectations for Lamar this season
Why Riddick has lower expectations for Lamar this season
4h

Kimberley A. Martin 'all-in' on Rams to the Super Bowl if Aaron Donald returns
Kimberley A. Martin 'all-in' on Rams to the Super Bowl if Aaron Donald returns
5h