
Atlanta Falcons @ Houston Texans

7-5, 3-3 Away
10
7-5, 3-3 Away

9-3, 5-1 Home
17
9-3, 5-1 Home
Game Leaders


267
M. RyanQB
20/47, 1 TD, 2 INT
267

188
T.J. YatesQB
12/25, 1 TD
188

44
M. TurnerRB
14 CAR
44
111
A. FosterRB
31 CAR, 1 TD
111
100
T. GonzalezTE
7 REC
100
97
A. JohnsonWR
4 REC
97

1
J. AbrahamLB
1

--
None
--

11
C. LoftonLB
11 SOLO
11

6
B. CushingLB
5 SOLO
6
Team Stats


337
Total Yards
337
2
Turnovers
1
18
1st Downs
20
7-43
Penalties
5-35
6/14
3rd Down
9/18
0/2
4th Down
1/1
1/3
Red Zone
2/2
24:56
Possession
35:04
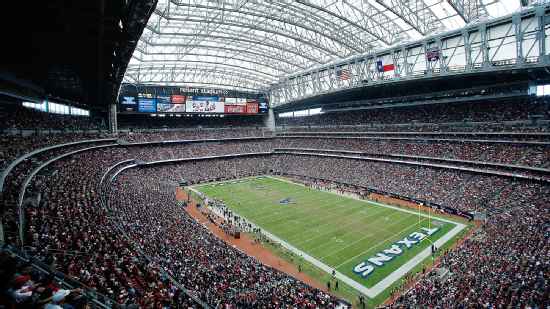
Game Information
Houston, TX
Referee:Bill Leavy
Team Stats
 | | |
|---|---|---|
| 1st Downs | 18 | 20 |
| Passing 1st downs | 13 | 9 |
| Rushing 1st downs | 3 | 9 |
| 1st downs from penalties | 2 | 2 |
| 3rd down efficiency | 6-14 | 9-18 |
| 4th down efficiency | 0-2 | 1-1 |
| Total Plays | 65 | 72 |
| Total Yards | 337 | 337 |
| Total Drives | 11 | 10 |
| Yards per Play | 5.2 | 4.7 |
| Passing | 267 | 175 |
| Comp/Att | 20/47 | 12/25 |
| Yards per pass | 5.7 | 6.3 |
| Interceptions thrown | 2 | 0 |
| Sacks-Yards Lost | 0-0 | 3-13 |
| Rushing | 70 | 162 |
| Rushing Attempts | 18 | 44 |
| Yards per rush | 3.9 | 3.7 |
| Red Zone (Made-Att) | 1-3 | 2-2 |
| Penalties | 7-43 | 5-35 |
| Turnovers | 2 | 1 |
| Fumbles lost | 0 | 1 |
| Interceptions thrown | 2 | 0 |
| Defensive / Special Teams TDs | 0 | 0 |
| Possession | 24:56 | 35:04 |
2025 Standings
National Football Conference
| NFC South | W | L | T | PCT | PF | PA |
|---|---|---|---|---|---|---|
| Carolina | 8 | 9 | 0 | .471 | 311 | 380 |
| Tampa Bay | 8 | 9 | 0 | .471 | 380 | 411 |
| Atlanta | 8 | 9 | 0 | .471 | 353 | 401 |
| New Orleans | 6 | 11 | 0 | .353 | 306 | 383 |
American Football Conference
| AFC South | W | L | T | PCT | PF | PA |
|---|---|---|---|---|---|---|
| Jacksonville | 13 | 4 | 0 | .765 | 474 | 336 |
| Houston | 12 | 5 | 0 | .706 | 404 | 295 |
| Indianapolis | 8 | 9 | 0 | .471 | 466 | 412 |
| Tennessee | 3 | 14 | 0 | .176 | 284 | 478 |
NFL News
Cowboys pass rusher Charles Snowden suspended 3 games by NFL
Cowboys outside linebacker Charles Snowden has been suspended for the first three games of the 2026 season, according to the NFL's transactions wire.
4h

Texans co-founder and senior chair Janice McNair dies at 89
Texans co-founder and senior chair Janice S. McNair died Tuesday in Houston at age 89, the team said.
4h

Investigation into alleged battery by Jets' Smith no longer active
An investigation of Geno Smith for an incident in which a woman accused him of battery last month is no longer active, and the New York Jets quarterback will not be charged.
5h