
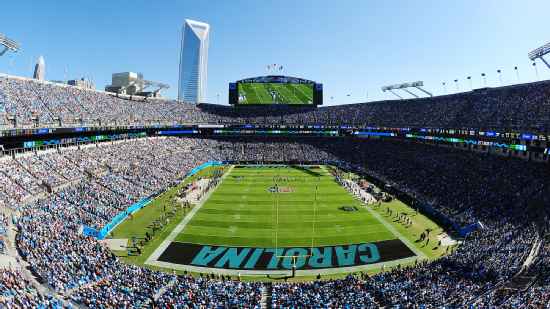
Dallas Cowboys @ Carolina Panthers

3-3, 2-2 Away
19
3-3, 2-2 Away

1-5, 1-3 Home
14
1-5, 1-3 Home
Game Leaders


227
T. RomoQB
24/34, 1 TD
227

233
C. NewtonQB
21/37, 1 TD, 1 INT
233
44
F. JonesRB
15 CAR
44
64
C. NewtonQB
6 CAR
64

97
M. AustinWR
5 REC, 1 TD
97

83
S. Smith Sr.WR
7 REC
83

1
A. SpencerDE
1

--
None
--

8
D. WareLB
3 SOLO
8

15
L. KuechlyLB
8 SOLO
15
Team Stats


312
Total Yards
328
1
Turnovers
2
18
1st Downs
18
6-43
Penalties
9-71
6/14
3rd Down
2/10
0/0
4th Down
0/2
0/0
Red Zone
0/0
33:37
Possession
26:23
Game Information
Charlotte, NC
Referee:Ron Winter
Team Stats
 | | |
|---|---|---|
| 1st Downs | 18 | 18 |
| Passing 1st downs | 11 | 9 |
| Rushing 1st downs | 4 | 7 |
| 1st downs from penalties | 3 | 2 |
| 3rd down efficiency | 6-14 | 2-10 |
| 4th down efficiency | 0-0 | 0-2 |
| Total Plays | 65 | 60 |
| Total Yards | 312 | 328 |
| Total Drives | 12 | 10 |
| Yards per Play | 4.8 | 5.5 |
| Passing | 227 | 216 |
| Comp/Att | 24/34 | 21/37 |
| Yards per pass | 6.7 | 5.5 |
| Interceptions thrown | 0 | 1 |
| Sacks-Yards Lost | 0-0 | 2-17 |
| Rushing | 85 | 112 |
| Rushing Attempts | 31 | 21 |
| Yards per rush | 2.7 | 5.3 |
| Red Zone (Made-Att) | 0-0 | 0-0 |
| Penalties | 6-43 | 9-71 |
| Turnovers | 1 | 2 |
| Fumbles lost | 1 | 1 |
| Interceptions thrown | 0 | 1 |
| Defensive / Special Teams TDs | 0 | 0 |
| Possession | 33:37 | 26:23 |
2025 Standings
National Football Conference
| NFC East | W | L | T | PCT | PF | PA |
|---|---|---|---|---|---|---|
| Philadelphia | 11 | 6 | 0 | .647 | 379 | 325 |
| Dallas | 7 | 9 | 1 | .441 | 471 | 511 |
| Washington | 5 | 12 | 0 | .294 | 356 | 451 |
| New York | 4 | 13 | 0 | .235 | 381 | 439 |
| NFC South | W | L | T | PCT | PF | PA |
|---|---|---|---|---|---|---|
| Carolina | 8 | 9 | 0 | .471 | 311 | 380 |
| Tampa Bay | 8 | 9 | 0 | .471 | 380 | 411 |
| Atlanta | 8 | 9 | 0 | .471 | 353 | 401 |
| New Orleans | 6 | 11 | 0 | .353 | 306 | 383 |
NFL News

2026 Fantasy Football Draft Guide: Rankings, mock drafts and analysis
Your one-stop shop as you prep for draft season, including rankings, projections and analysis.
7h

Fantasy football: 12 players who will bounce back this season
Eric Karabell highlights players who disappointed in 2025, but are poised for a better 2026.
7h
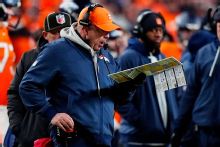
Sean Payton called a fourth-down fake punt against Buffalo Bills
As the Denver Broncos made their run to the AFC Championship earlier this year, ESPN's Seth Wickersham spent all two weeks of the playoffs with coach Sean Payton.
7h