
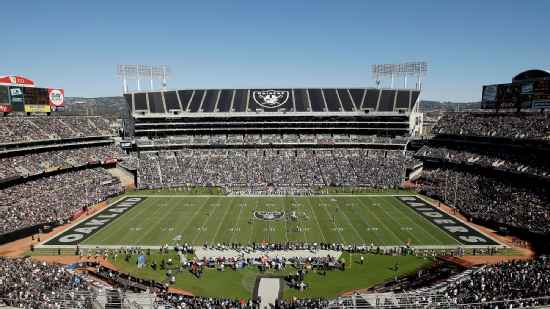
New Orleans Saints @ Oakland Raiders

5-5, 2-3 Away
38
5-5, 2-3 Away

3-7, 2-3 Home
17
3-7, 2-3 Home
Game Leaders


219
D. BreesQB
20/27, 3 TD
219
312
C. PalmerQB
22/40, 2 TD, 2 INT
312

67
M. Ingram IIRB
12 CAR, 1 TD
67
103
M. ReeceFB
19 CAR
103

69
M. ColstonWR
4 REC
69
90
M. ReeceFB
4 REC
90
1
J. VilmaLB
1

--
None
--

11
R. HarperS
9 SOLO
11

11
M. MitchellS
7 SOLO
11
Team Stats


380
Total Yards
404
0
Turnovers
2
19
1st Downs
24
11-109
Penalties
4-40
6/11
3rd Down
4/12
0/0
4th Down
1/3
0/0
Red Zone
0/0
28:36
Possession
31:24
Game Information
Oakland, CA
Referee:Pete Morelli
Team Stats
 | | |
|---|---|---|
| 1st Downs | 19 | 24 |
| Passing 1st downs | 14 | 15 |
| Rushing 1st downs | 5 | 7 |
| 1st downs from penalties | 0 | 2 |
| 3rd down efficiency | 6-11 | 4-12 |
| 4th down efficiency | 0-0 | 1-3 |
| Total Plays | 56 | 69 |
| Total Yards | 380 | 404 |
| Total Drives | 10 | 11 |
| Yards per Play | 6.8 | 5.9 |
| Passing | 229 | 284 |
| Comp/Att | 21/28 | 22/40 |
| Yards per pass | 8.2 | 6.6 |
| Interceptions thrown | 0 | 2 |
| Sacks-Yards Lost | 0-0 | 3-28 |
| Rushing | 151 | 120 |
| Rushing Attempts | 28 | 26 |
| Yards per rush | 5.4 | 4.6 |
| Red Zone (Made-Att) | 0-0 | 0-0 |
| Penalties | 11-109 | 4-40 |
| Turnovers | 0 | 2 |
| Fumbles lost | 0 | 0 |
| Interceptions thrown | 0 | 2 |
| Defensive / Special Teams TDs | 2 | 0 |
| Possession | 28:36 | 31:24 |
2025 Standings
National Football Conference
| NFC South | W | L | T | PCT | PF | PA |
|---|---|---|---|---|---|---|
| Carolina | 8 | 9 | 0 | .471 | 311 | 380 |
| Tampa Bay | 8 | 9 | 0 | .471 | 380 | 411 |
| Atlanta | 8 | 9 | 0 | .471 | 353 | 401 |
| New Orleans | 6 | 11 | 0 | .353 | 306 | 383 |
NFL News

Inside Brendan Sorsby's eligibility saga and the scars it left
The fighting behind the scenes between the Big 12 and Texas Tech, and the NFL's ultimate decision of denial.
6h

2026 Fantasy Football Draft Guide: Rankings, mock drafts and analysis
Your one-stop shop as you prep for draft season, including rankings, projections and analysis.
8h

Fantasy football: 12 players who will bounce back this season
Eric Karabell highlights players who disappointed in 2025, but are poised for a better 2026.
8h