
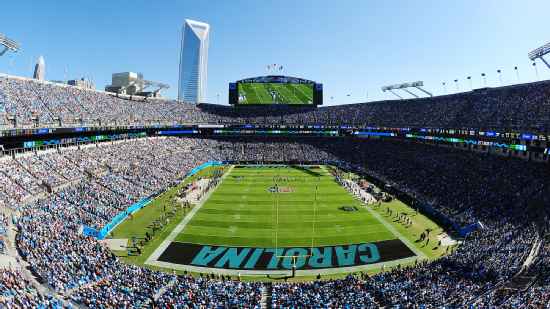
Atlanta Falcons @ Carolina Panthers

11-2, 5-2 Away
20
11-2, 5-2 Away

4-9, 2-5 Home
30
4-9, 2-5 Home
Game Leaders


Team Stats


362
Total Yards
475
1
Turnovers
0
25
1st Downs
23
3-15
Penalties
3-10
2/8
3rd Down
9/15
1/2
4th Down
1/1
0/0
Red Zone
0/0
24:13
Possession
35:47
Game Information
Charlotte, NC
Referee:Ed Hochuli
Team Stats
 | | |
|---|---|---|
| 1st Downs | 25 | 23 |
| Passing 1st downs | 22 | 12 |
| Rushing 1st downs | 2 | 10 |
| 1st downs from penalties | 1 | 1 |
| 3rd down efficiency | 2-8 | 9-15 |
| 4th down efficiency | 1-2 | 1-1 |
| Total Plays | 62 | 68 |
| Total Yards | 362 | 475 |
| Total Drives | 8 | 10 |
| Yards per Play | 5.8 | 7.0 |
| Passing | 327 | 280 |
| Comp/Att | 34/49 | 23/35 |
| Yards per pass | 6.4 | 7.8 |
| Interceptions thrown | 1 | 0 |
| Sacks-Yards Lost | 2-15 | 1-7 |
| Rushing | 35 | 195 |
| Rushing Attempts | 11 | 32 |
| Yards per rush | 3.2 | 6.1 |
| Red Zone (Made-Att) | 0-0 | 0-0 |
| Penalties | 3-15 | 3-10 |
| Turnovers | 1 | 0 |
| Fumbles lost | 0 | 0 |
| Interceptions thrown | 1 | 0 |
| Defensive / Special Teams TDs | 0 | 0 |
| Possession | 24:13 | 35:47 |
2025 Standings
National Football Conference
| NFC South | W | L | T | PCT | PF | PA |
|---|---|---|---|---|---|---|
| Carolina | 8 | 9 | 0 | .471 | 311 | 380 |
| Tampa Bay | 8 | 9 | 0 | .471 | 380 | 411 |
| Atlanta | 8 | 9 | 0 | .471 | 353 | 401 |
| New Orleans | 6 | 11 | 0 | .353 | 306 | 383 |
NFL News

How changes to coaching staff will impact the Packers
The offense brings back a familiar face in Luke Getsy, while Jonathan Gannon appears set to bring a 3-4 base.
34m

Sources: Free agent Zach Wilson agrees to deal with Saints
The Saints have agreed to a one-year deal with QB Zach Wilson, sources confirmed to ESPN's Adam Schefter.
7h

49ers 2026 free agency tracker: Offseason moves, signings
Keep track of all the 49ers' moves this offseason, including free agent signings, contracts and more.
12h