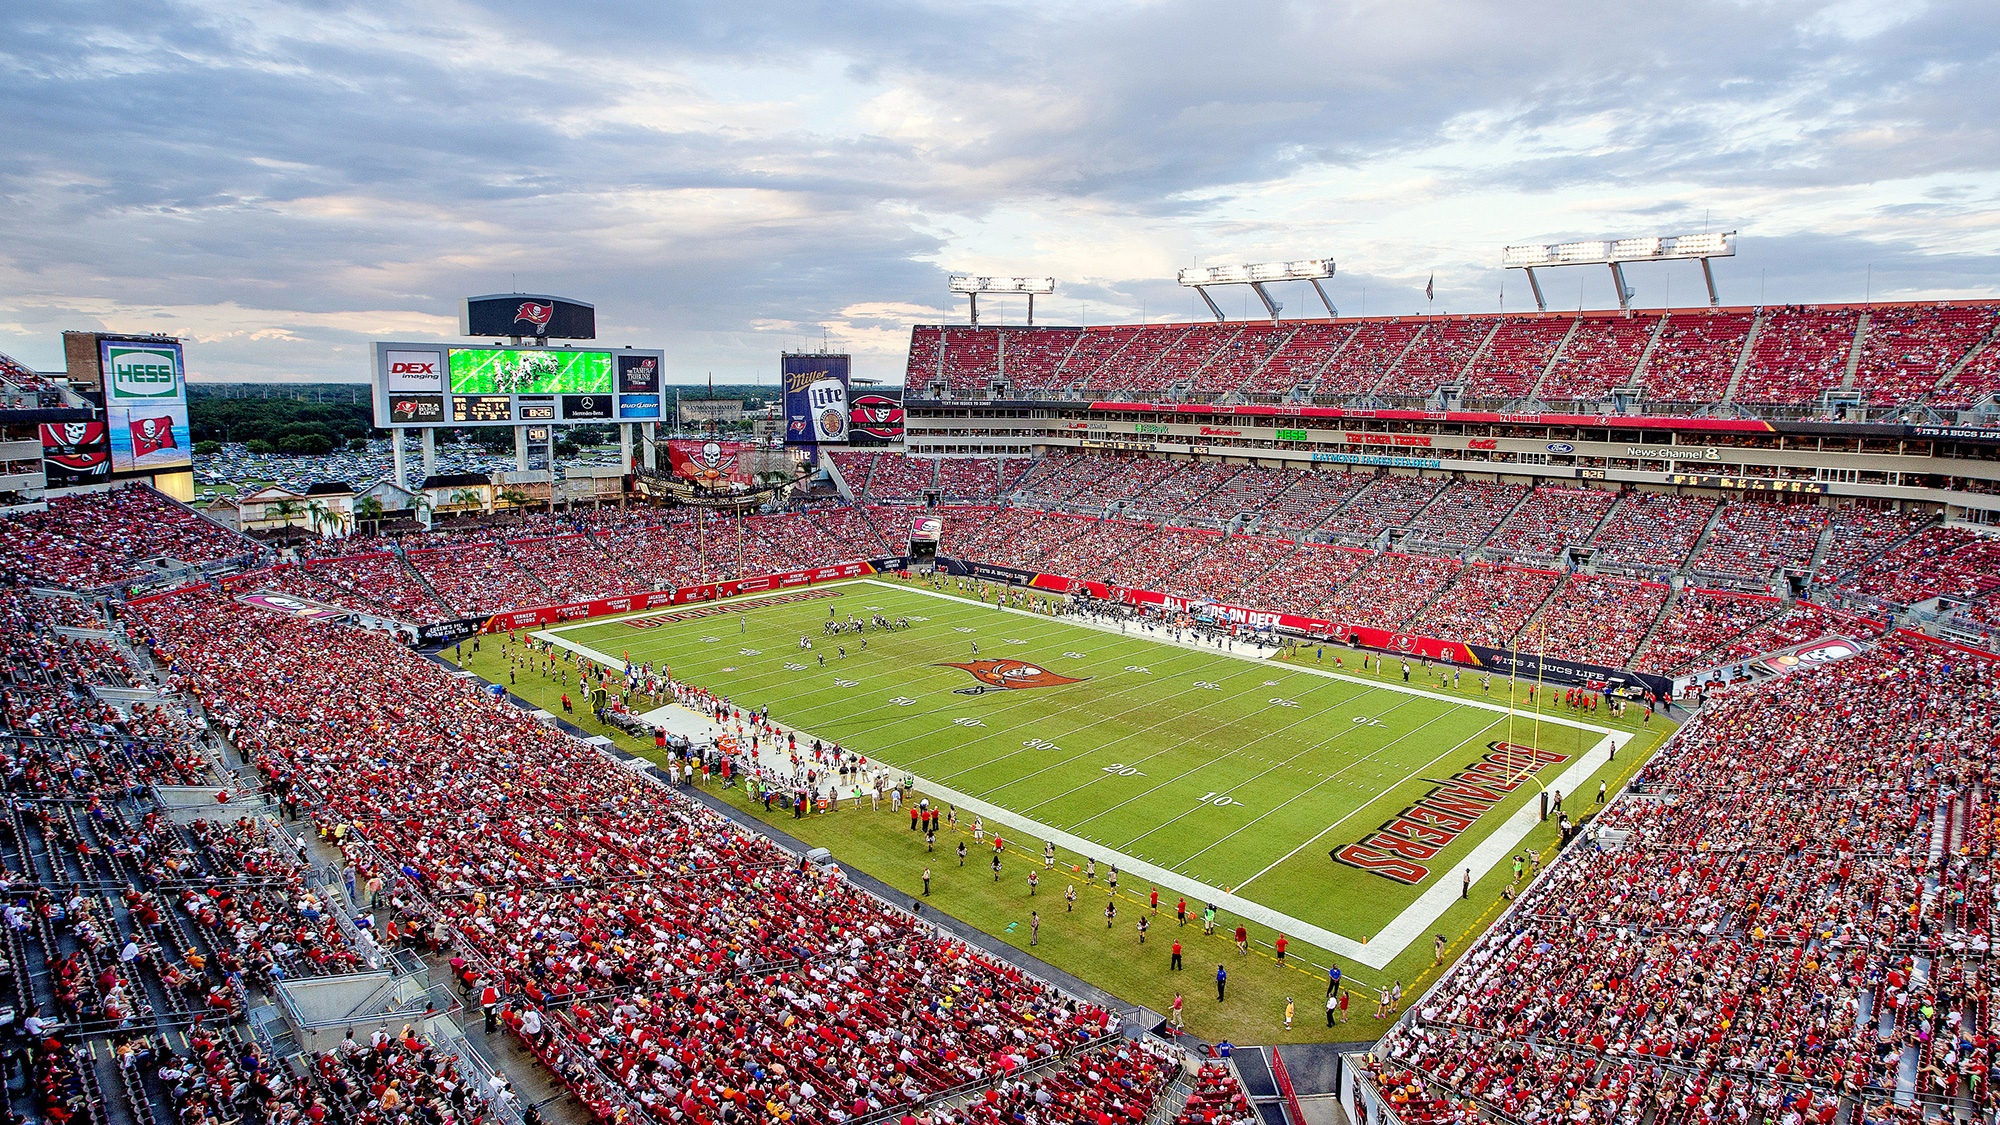
Carolina Panthers @ Tampa Bay Buccaneers
Game Leaders

154
C. NewtonQB
18/32, 1 TD, 1 INT
154

210
J. WinstonQB
21/38, 2 INT
210

44
C. NewtonQB
11 CAR
44

71
D. MartinRB
18 CAR
71

49
C. McCaffreyRB
5 REC
49

64
C. BrateTE
4 REC
64

1.5
M. AddisonDE
1.5

--
--

9
K. ColemanS
7 SOLO
9

10
K. AlexanderLB
6 SOLO
10
Team Stats
254
Total Yards
279
1
Turnovers
3
14
1st Downs
16
5-51
Penalties
6-55
8/17
3rd Down
2/12
0/0
4th Down
0/1
2/3
Red Zone
0/1
32:11
Possession
27:49
Game Information
Tampa, FL


Team Stats
| 1st Downs | 14 | 16 |
| Passing 1st downs | 6 | 9 |
| Rushing 1st downs | 8 | 6 |
| 1st downs from penalties | 0 | 1 |
| 3rd down efficiency | 8-17 | 2-12 |
| 4th down efficiency | 0-0 | 0-1 |
| Total Plays | 63 | 63 |
| Total Yards | 254 | 279 |
| Total Drives | 12 | 12 |
| Yards per Play | 4.0 | 4.4 |
| Passing | 154 | 194 |
| Comp/Att | 18/32 | 21/38 |
| Yards per pass | 4.8 | 4.7 |
| Interceptions thrown | 1 | 2 |
| Sacks-Yards Lost | 0-0 | 3-16 |
| Rushing | 100 | 85 |
| Rushing Attempts | 31 | 22 |
| Yards per rush | 3.2 | 3.9 |
| Red Zone (Made-Att) | 2-3 | 0-1 |
| Penalties | 5-51 | 6-55 |
| Turnovers | 1 | 3 |
| Fumbles lost | 0 | 1 |
| Interceptions thrown | 1 | 2 |
| Defensive / Special Teams TDs | 0 | 0 |
| Possession | 32:11 | 27:49 |
2025 Standings
National Football Conference
| NFC South | W | L | T | PCT | PF | PA |
|---|---|---|---|---|---|---|
| Carolina | 8 | 9 | 0 | .471 | 311 | 380 |
| Tampa Bay | 8 | 9 | 0 | .471 | 380 | 411 |
| Atlanta | 8 | 9 | 0 | .471 | 353 | 401 |
| New Orleans | 6 | 11 | 0 | .353 | 306 | 383 |
NFL News

Seahawks laud 'unwavering' Sam Darnold after Super Bowl LX win
A victorious Seahawks locker room lauded their "unwavering" quarterback Sam Darnold, whose steadiness through injury and turnover-related adversity this season culminated in a Super Bowl LX victory.
2h

Patriots' Maye: Had injection for shoulder before Super Bowl
Patriots QB Drake Maye acknowledged he received a pain-killing injection for his injured right throwing shoulder before Sunday's loss, but maintained he was "good to go" for the game and just didn't make enough plays in the end.
3h

ESPN set to air Super Bowl LXI in 2027
Scott Van Pelt takes "The Handoff" from Super Bowl LX as ESPN will air the Super Bowl in 2027 for the first time in network history.
5h
GAMBLING PROBLEM? CALL 1-800-GAMBLER, (800) 327-5050 or visit gamblinghelplinema.org (MA). Call 877-8-HOPENY/text HOPENY (467369) (NY). Please Gamble Responsibly. 888-789-7777/visit ccpg.org (CT), or visit www.mdgamblinghelp.org (MD). 21+ and present in most states. (18+ DC/KY/NH/WY). Void in ONT/OR/NH. Eligibility restrictions apply. On behalf of Boot Hill Casino & Resort (KS). Terms: sportsbook.draftkings.com/promos.
Copyright: © 2026 ESPN Enterprises, Inc. All rights reserved.


