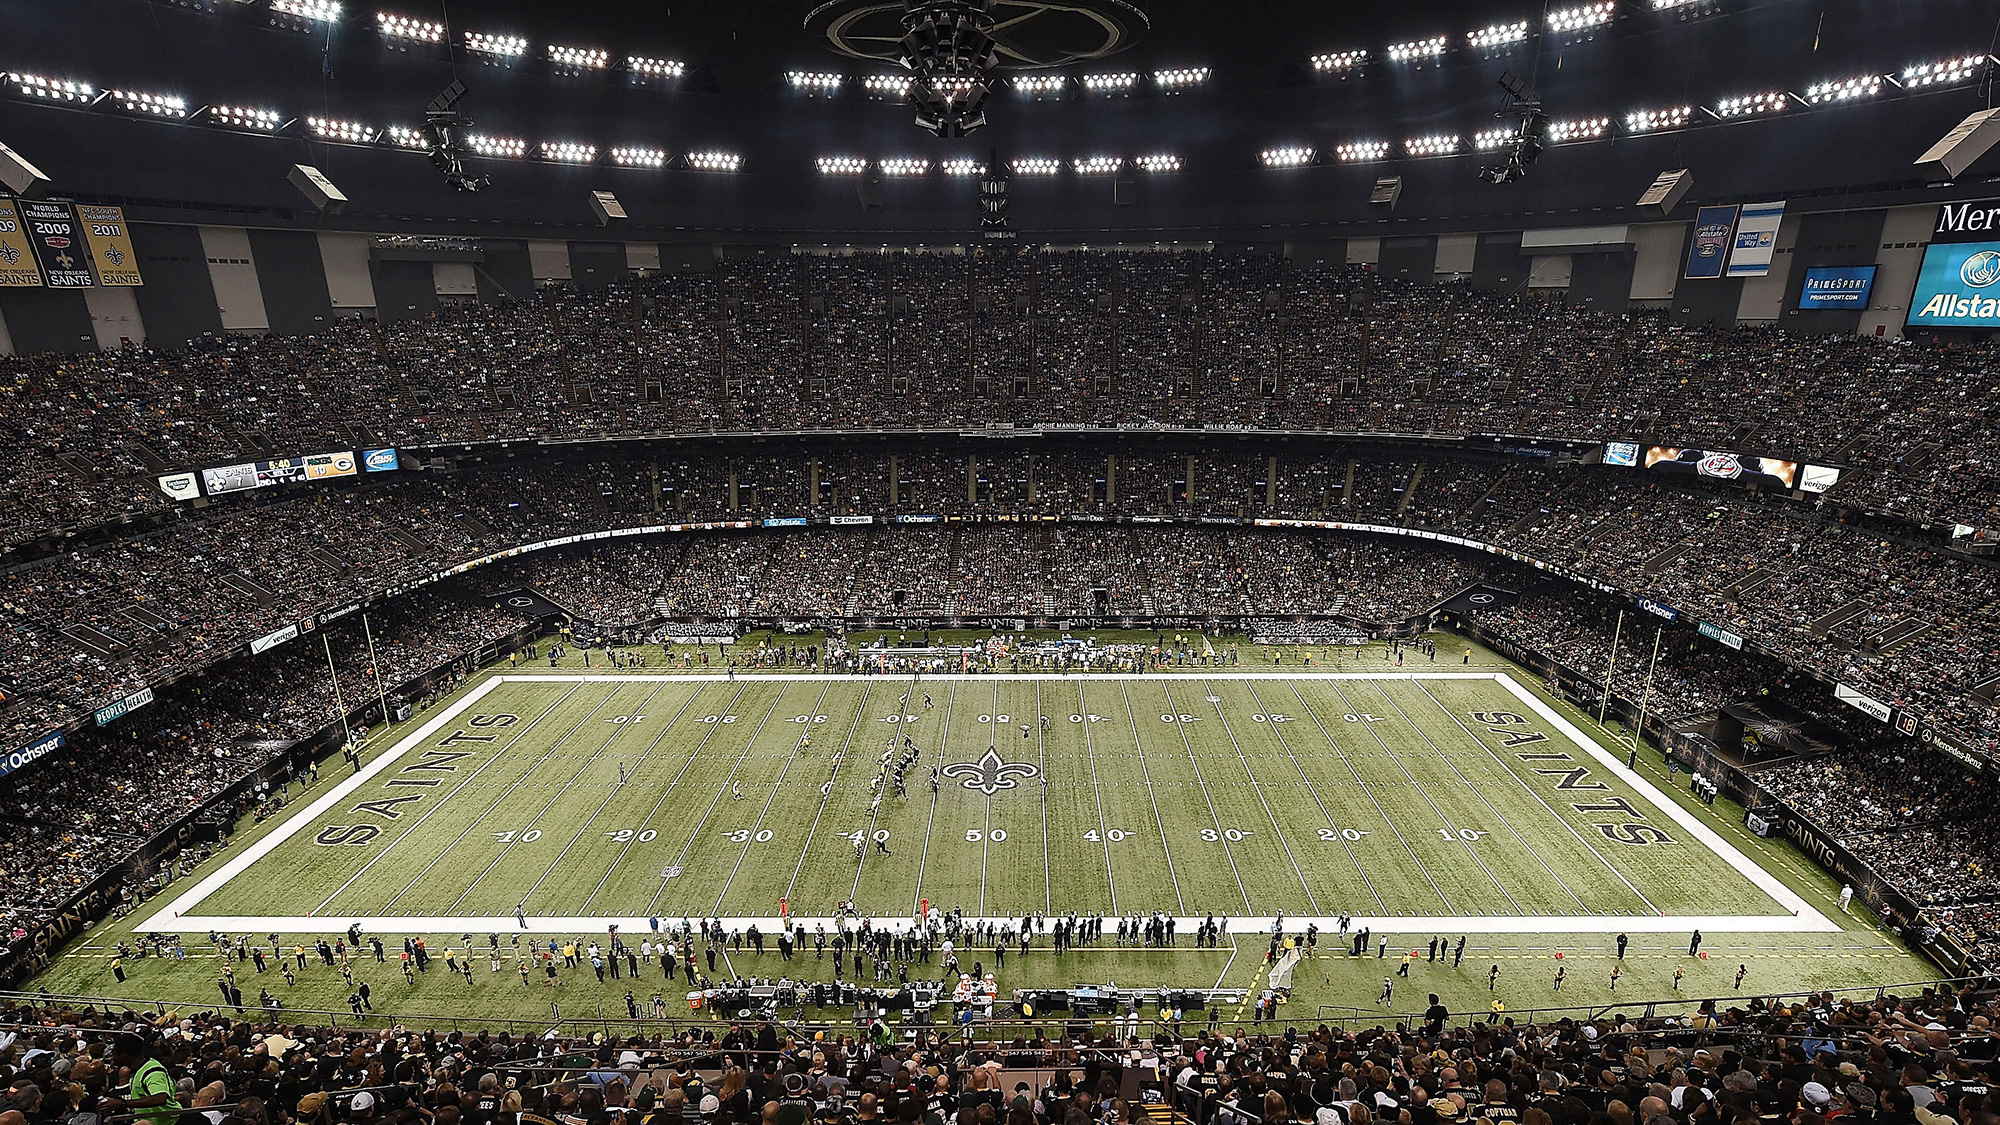
Philadelphia Eagles @ New Orleans Saints
Game Leaders

156
C. WentzQB
19/33, 3 INT
156

363
D. BreesQB
22/30, 4 TD
363

53
J. AdamsRB
7 CAR, 1 TD
53

103
M. Ingram IIRB
16 CAR, 2 TD
103

48
G. TateWR
5 REC
48

157
T. SmithWR
10 REC, 1 TD
157

--
--

1
C. RobertsonLB
1

9
C. GrahamS
7 SOLO
9

4
M. LattimoreCB
4 SOLO
4
Team Stats
196
Total Yards
546
3
Turnovers
0
13
1st Downs
28
6-49
Penalties
8-69
3/10
3rd Down
6/11
0/2
4th Down
1/1
0/1
Red Zone
4/5
22:26
Possession
37:34
Game Information
New Orleans, LA

Umpire:Barry Anderson
Line Judge:Gary Arthur
Referee:Carl Cheffers
Back Judge:Greg Meyer
Down Judge:Michael Spanier
Side Judge:Eugene Hall
Field Judge:Land Clark

Team Stats
| 1st Downs | 13 | 28 |
| Passing 1st downs | 9 | 21 |
| Rushing 1st downs | 2 | 6 |
| 1st downs from penalties | 2 | 1 |
| 3rd down efficiency | 3-10 | 6-11 |
| 4th down efficiency | 0-2 | 1-1 |
| Total Plays | 48 | 69 |
| Total Yards | 196 | 546 |
| Total Drives | 11 | 11 |
| Yards per Play | 4.1 | 7.9 |
| Passing | 138 | 373 |
| Comp/Att | 19/33 | 23/32 |
| Yards per pass | 3.8 | 11.7 |
| Interceptions thrown | 3 | 0 |
| Sacks-Yards Lost | 3-18 | 0-0 |
| Rushing | 58 | 173 |
| Rushing Attempts | 12 | 37 |
| Yards per rush | 4.8 | 4.7 |
| Red Zone (Made-Att) | 0-1 | 4-5 |
| Penalties | 6-49 | 8-69 |
| Turnovers | 3 | 0 |
| Fumbles lost | 0 | 0 |
| Interceptions thrown | 3 | 0 |
| Defensive / Special Teams TDs | 0 | 0 |
| Possession | 22:26 | 37:34 |
2025 Standings
National Football Conference
| NFC East | W | L | T | PCT | PF | PA |
|---|---|---|---|---|---|---|
| Philadelphia | 11 | 6 | 0 | .647 | 379 | 325 |
| Dallas | 7 | 9 | 1 | .441 | 471 | 511 |
| Washington | 5 | 12 | 0 | .294 | 356 | 451 |
| New York | 4 | 13 | 0 | .235 | 381 | 439 |
| NFC South | W | L | T | PCT | PF | PA |
|---|---|---|---|---|---|---|
| Carolina | 8 | 9 | 0 | .471 | 311 | 380 |
| Tampa Bay | 8 | 9 | 0 | .471 | 380 | 411 |
| Atlanta | 8 | 9 | 0 | .471 | 353 | 401 |
| New Orleans | 6 | 11 | 0 | .353 | 306 | 383 |
NFL News

Seahawks laud 'unwavering' Sam Darnold after Super Bowl LX win
A victorious Seahawks locker room lauded their "unwavering" quarterback Sam Darnold, whose steadiness through injury and turnover-related adversity this season culminated in a Super Bowl LX victory.
1m

Patriots' Maye: Had injection for shoulder before Super Bowl
Patriots QB Drake Maye acknowledged he received a pain-killing injection for his injured right throwing shoulder before Sunday's loss, but maintained he was "good to go" for the game and just didn't make enough plays in the end.
1h

ESPN set to air Super Bowl LXI in 2027
Scott Van Pelt takes "The Handoff" from Super Bowl LX as ESPN will air the Super Bowl in 2027 for the first time in network history.
3h
GAMBLING PROBLEM? CALL 1-800-GAMBLER, (800) 327-5050 or visit gamblinghelplinema.org (MA). Call 877-8-HOPENY/text HOPENY (467369) (NY). Please Gamble Responsibly. 888-789-7777/visit ccpg.org (CT), or visit www.mdgamblinghelp.org (MD). 21+ and present in most states. (18+ DC/KY/NH/WY). Void in ONT/OR/NH. Eligibility restrictions apply. On behalf of Boot Hill Casino & Resort (KS). Terms: sportsbook.draftkings.com/promos.
Copyright: © 2026 ESPN Enterprises, Inc. All rights reserved.


