
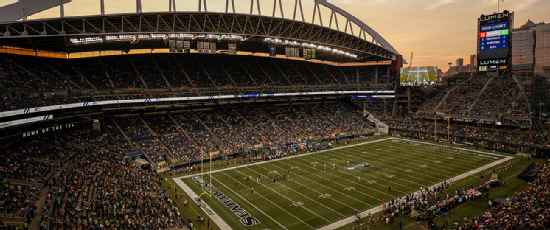
New York Giants @ Seattle Seahawks

1-2, 1-1 Away
30
1-2, 1-1 Away

3-0, 2-0 Home
42
3-0, 2-0 Home
Game Leaders


Team Stats


337
Total Yards
333
4
Turnovers
3
18
1st Downs
26
8-63
Penalties
4-22
2/9
3rd Down
10/16
1/1
4th Down
1/1
1/2
Red Zone
5/5
22:00
Possession
38:00
Game Information
Seattle, WA
Referee:Mike Carey
Team Stats
 | | |
|---|---|---|
| 1st Downs | 18 | 26 |
| Passing 1st downs | 15 | 15 |
| Rushing 1st downs | 3 | 10 |
| 1st downs from penalties | 0 | 1 |
| 3rd down efficiency | 2-9 | 10-16 |
| 4th down efficiency | 1-1 | 1-1 |
| Total Plays | 52 | 74 |
| Total Yards | 337 | 333 |
| Total Drives | 15 | 13 |
| Yards per Play | 6.5 | 4.5 |
| Passing | 264 | 227 |
| Comp/Att | 24/36 | 24/33 |
| Yards per pass | 7.1 | 6.9 |
| Interceptions thrown | 3 | 3 |
| Sacks-Yards Lost | 1-11 | 0-0 |
| Rushing | 73 | 106 |
| Rushing Attempts | 15 | 41 |
| Yards per rush | 4.9 | 2.6 |
| Red Zone (Made-Att) | 1-2 | 5-5 |
| Penalties | 8-63 | 4-22 |
| Turnovers | 4 | 3 |
| Fumbles lost | 1 | 0 |
| Interceptions thrown | 3 | 3 |
| Defensive / Special Teams TDs | 2 | 0 |
| Possession | 22:00 | 38:00 |
2025 Standings
National Football Conference
| NFC East | W | L | T | PCT | PF | PA |
|---|---|---|---|---|---|---|
| Philadelphia | 11 | 6 | 0 | .647 | 379 | 325 |
| Dallas | 7 | 9 | 1 | .441 | 471 | 511 |
| Washington | 5 | 12 | 0 | .294 | 356 | 451 |
| New York | 4 | 13 | 0 | .235 | 381 | 439 |
| NFC West | W | L | T | PCT | PF | PA |
|---|---|---|---|---|---|---|
| Seattle | 14 | 3 | 0 | .824 | 483 | 292 |
| Los Angeles | 12 | 5 | 0 | .706 | 518 | 346 |
| San Francisco | 12 | 5 | 0 | .706 | 437 | 371 |
| Arizona | 3 | 14 | 0 | .176 | 355 | 488 |
NFL News

What's next for the Seahawks? Why a critical offseason awaits
Seattle has to make decisions on a new OC and whether to re-sign Super Bowl MVP Kenneth Walker III.
4h

Is Trevor Lawrence's 2025 success sustainable?
Trevor Lawrence's final eight games propelled him to being named an MVP finalist in 2025. Can he continue it next season?
6h

Zachary Orr joining Seattle as ILBs coach, sources say
The Seahawks are hiring former Ravens defensive coordinator Zachary Orr as their inside linebackers coach, sources told ESPN's Adam Schefter and Jeremy Fowler on Friday.
17h