
Los Angeles Rams @ Jacksonville Jaguars

4-2, 3-0 Away
27
4-2, 3-0 Away

3-3, 1-2 Home
17
3-3, 1-2 Home
Game Leaders


Team Stats


249
Total Yards
389
1
Turnovers
1
12
1st Downs
19
7-70
Penalties
5-40
4/13
3rd Down
4/15
0/0
4th Down
1/1
1/2
Red Zone
0/1
28:01
Possession
31:59
Game Information
Jacksonville, FL

Team Stats
 | | |
|---|---|---|
| 1st Downs | 12 | 19 |
| Passing 1st downs | 7 | 12 |
| Rushing 1st downs | 5 | 5 |
| 1st downs from penalties | 0 | 2 |
| 3rd down efficiency | 4-13 | 4-15 |
| 4th down efficiency | 0-0 | 1-1 |
| Total Plays | 56 | 66 |
| Total Yards | 249 | 389 |
| Total Drives | 13 | 14 |
| Yards per Play | 4.4 | 5.9 |
| Passing | 107 | 220 |
| Comp/Att | 11/21 | 23/35 |
| Yards per pass | 4.5 | 5.5 |
| Interceptions thrown | 0 | 1 |
| Sacks-Yards Lost | 3-17 | 5-21 |
| Rushing | 142 | 169 |
| Rushing Attempts | 32 | 26 |
| Yards per rush | 4.4 | 6.5 |
| Red Zone (Made-Att) | 1-2 | 0-1 |
| Penalties | 7-70 | 5-40 |
| Turnovers | 1 | 1 |
| Fumbles lost | 1 | 0 |
| Interceptions thrown | 0 | 1 |
| Defensive / Special Teams TDs | 2 | 0 |
| Possession | 28:01 | 31:59 |
LAR @ JAX Videos
Jaguars' ceiling limited by Bortles
2025 Standings
National Football Conference
| NFC West | W | L | T | PCT | PF | PA |
|---|---|---|---|---|---|---|
| Seattle | 14 | 3 | 0 | .824 | 483 | 292 |
| Los Angeles | 12 | 5 | 0 | .706 | 518 | 346 |
| San Francisco | 12 | 5 | 0 | .706 | 437 | 371 |
| Arizona | 3 | 14 | 0 | .176 | 355 | 488 |
American Football Conference
| AFC South | W | L | T | PCT | PF | PA |
|---|---|---|---|---|---|---|
| Jacksonville | 13 | 4 | 0 | .765 | 474 | 336 |
| Houston | 12 | 5 | 0 | .706 | 404 | 295 |
| Indianapolis | 8 | 9 | 0 | .471 | 466 | 412 |
| Tennessee | 3 | 14 | 0 | .176 | 284 | 478 |
NFL News

Former Purdue, NFL wide receiver Rondale Moore dies at age 25
Former Purdue and NFL wide receiver Rondale Moore died Saturday at the age of 25, according to the Minnesota Vikings.
5h

Sources: Cowboys agree to three-year deal with RB Williams
The Cowboys and free-agent-to-be running back Javonte Williams reached agreement on a three-year contract that includes $16 million in guaranteed money, sources told ESPN's Adam Schefter on Saturday.
12h
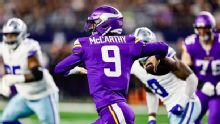
Will Vikings commit to starting a QB addition over McCarthy?
How the Vikings handle their QB room will reveal a lot about what they think of McCarthy's future in Minnesota.
1d