
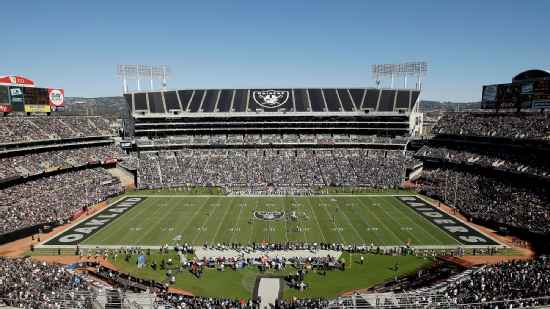
Los Angeles Chargers @ Oakland Raiders

2-4, 2-1 Away
17
2-4, 2-1 Away

2-4, 1-2 Home
16
2-4, 1-2 Home
Game Leaders


Team Stats


343
Total Yards
274
1
Turnovers
2
20
1st Downs
15
4-32
Penalties
5-40
6/14
3rd Down
6/12
1/2
4th Down
0/1
2/3
Red Zone
0/1
32:03
Possession
27:57
Game Information
Oakland, CA
Team Stats
 | | |
|---|---|---|
| 1st Downs | 20 | 15 |
| Passing 1st downs | 15 | 7 |
| Rushing 1st downs | 5 | 6 |
| 1st downs from penalties | 0 | 2 |
| 3rd down efficiency | 6-14 | 6-12 |
| 4th down efficiency | 1-2 | 0-1 |
| Total Plays | 65 | 53 |
| Total Yards | 343 | 274 |
| Total Drives | 10 | 10 |
| Yards per Play | 5.3 | 5.2 |
| Passing | 263 | 165 |
| Comp/Att | 25/36 | 21/30 |
| Yards per pass | 7.1 | 5.3 |
| Interceptions thrown | 0 | 2 |
| Sacks-Yards Lost | 1-5 | 1-6 |
| Rushing | 80 | 109 |
| Rushing Attempts | 28 | 22 |
| Yards per rush | 2.9 | 5.0 |
| Red Zone (Made-Att) | 2-3 | 0-1 |
| Penalties | 4-32 | 5-40 |
| Turnovers | 1 | 2 |
| Fumbles lost | 1 | 0 |
| Interceptions thrown | 0 | 2 |
| Defensive / Special Teams TDs | 0 | 0 |
| Possession | 32:03 | 27:57 |
LAC @ OAK Videos
Who are these Raiders?
2025 Standings
American Football Conference
| AFC West | W | L | T | PCT | PF | PA |
|---|---|---|---|---|---|---|
| Denver | 14 | 3 | 0 | .824 | 401 | 311 |
| Los Angeles | 11 | 6 | 0 | .647 | 368 | 340 |
| Kansas City | 6 | 11 | 0 | .353 | 362 | 328 |
| Las Vegas | 3 | 14 | 0 | .176 | 241 | 432 |
NFL News

Broncos enter free agency clear of Russell Wilson dead money
After being saddled with massive dead money cap hits over the past two years, the Broncos enter the 2026 offseason with a clean slate.
2h

Walker? Etienne? Love? Chiefs mulling options at running back
Following a 6-11 campaign in 2025, one of the Chiefs' top priorities this spring is to upgrade the position.
2h

Ravens making strong push to keep free agent Tyler Linderbaum
Can Baltimore stop its top free agent from hitting the open market again?
2h