
Minnesota Vikings @ Indianapolis Colts

0-2, 0-1 Away
11
0-2, 0-1 Away

1-1, 1-0 Home
28
1-1, 1-0 Home
Game Leaders


Team Stats


175
Total Yards
354
3
Turnovers
1
12
1st Downs
24
6-45
Penalties
9-93
2/9
3rd Down
3/11
0/0
4th Down
1/1
1/2
Red Zone
2/4
21:35
Possession
38:25
Game Information
Indianapolis, IN
Team Stats
 | | |
|---|---|---|
| 1st Downs | 12 | 24 |
| Passing 1st downs | 5 | 10 |
| Rushing 1st downs | 3 | 11 |
| 1st downs from penalties | 4 | 3 |
| 3rd down efficiency | 2-9 | 3-11 |
| 4th down efficiency | 0-0 | 1-1 |
| Total Plays | 47 | 67 |
| Total Yards | 175 | 354 |
| Total Drives | 10 | 10 |
| Yards per Play | 3.7 | 5.3 |
| Passing | 95 | 203 |
| Comp/Att | 11/26 | 19/25 |
| Yards per pass | 3.3 | 7.5 |
| Interceptions thrown | 3 | 1 |
| Sacks-Yards Lost | 3-18 | 2-11 |
| Rushing | 80 | 151 |
| Rushing Attempts | 18 | 40 |
| Yards per rush | 4.4 | 3.8 |
| Red Zone (Made-Att) | 1-2 | 2-4 |
| Penalties | 6-45 | 9-93 |
| Turnovers | 3 | 1 |
| Fumbles lost | 0 | 0 |
| Interceptions thrown | 3 | 1 |
| Defensive / Special Teams TDs | 0 | 0 |
| Possession | 21:35 | 38:25 |
2025 Standings
American Football Conference
| AFC South | W | L | T | PCT | PF | PA |
|---|---|---|---|---|---|---|
| Jacksonville | 13 | 4 | 0 | .765 | 474 | 336 |
| Houston | 12 | 5 | 0 | .706 | 404 | 295 |
| Indianapolis | 8 | 9 | 0 | .471 | 466 | 412 |
| Tennessee | 3 | 14 | 0 | .176 | 284 | 478 |
NFL News
2026 NFL draft: Favorite team fits for 20 top prospects
We took 20 NFL draft prospects who could get picked in Rounds 1 and 2 and found ideal scheme matches based on what each player does best.
14h

18-game regular season? Mixed reaction by NFL owners, coaches
Colts, Chiefs, Browns and Patriots owners among those talking about the feasibility of expanding the schedule.
14h
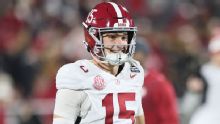
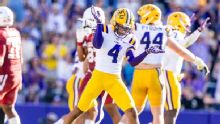
Will fewer CFB starts affect QB Ty Simpson's NFL draft stock?
The Alabama product is regarded as the 2026 NFL draft's QB2 despite having far fewer starts (15) than most first-round signal-callers.
13h