
UTEP Miners @ Tulsa Golden Hurricane

1-6, 0-4 Away
11
1-6, 0-4 Away

6-1, 4-0 Home
33
6-1, 4-0 Home
Game Leaders


257
C. MegerQB
16/23, 1 TD, 1 INT
257
198
C. GreenQB
13/22
198
25
J. BellRB
9 CAR
25
128
J. DouglasRB
13 CAR, 1 TD
128
218
J. LeslieWR
10 REC, 1 TD
218
62
T. RobersonWR
3 REC
62
--
--
3
D. BrownLB
3
11
D. GraysonDB
7 SOLO
11
14
D. BrownLB
7 SOLO
14
Team Stats


407
Total Yards
479
3
Turnovers
1
26
1st Downs
20
3-25
Penalties
4-38
3/14
3rd Down
8/17
1/3
4th Down
2/2
29:08
Possession
30:22
Game Information
Tulsa, OK
Team Stats
 | | |
|---|---|---|
| 1st Downs | 26 | 20 |
| 3rd down efficiency | 3-14 | 8-17 |
| 4th down efficiency | 1-3 | 2-2 |
| Total Yards | 407 | 479 |
| Passing | 376 | 198 |
| Comp/Att | 27/42 | 13/23 |
| Yards per pass | 9.0 | 8.6 |
| Interceptions thrown | 1 | 0 |
| Rushing | 31 | 281 |
| Rushing Attempts | 33 | 54 |
| Yards per rush | 0.9 | 5.2 |
| Penalties | 3-25 | 4-38 |
| Turnovers | 3 | 1 |
| Fumbles lost | 2 | 1 |
| Interceptions thrown | 1 | 0 |
| Possession | 29:08 | 30:22 |
2025 Standings
FBS
| Mountain West Conference | CONF | OVR |
|---|---|---|
| Boise State | 6-2 | 9-5 |
| New Mexico | 6-2 | 9-4 |
| San Diego State | 6-2 | 9-4 |
| UNLV | 6-2 | 10-4 |
| Fresno State | 5-3 | 9-4 |
| Hawai'i | 5-3 | 9-4 |
| Utah State | 4-4 | 6-7 |
| Air Force | 3-5 | 4-8 |
| Nevada | 2-6 | 3-9 |
| Wyoming | 2-6 | 4-8 |
| San José State | 2-6 | 3-9 |
| Colorado State | 1-7 | 2-10 |
| American Conference | CONF | OVR |
|---|---|---|
| Tulane | 7-1 | 11-3 |
| North Texas | 7-1 | 12-2 |
| Navy | 7-1 | 11-2 |
| East Carolina | 6-2 | 9-4 |
| South Florida | 6-2 | 9-4 |
| Army | 4-4 | 7-6 |
| Memphis | 4-4 | 8-5 |
| UTSA | 4-4 | 7-6 |
| Temple | 3-5 | 5-7 |
| Florida Atlantic | 3-5 | 4-8 |
| Rice | 2-6 | 5-8 |
| UAB | 2-6 | 4-8 |
| Tulsa | 1-7 | 4-8 |
| Charlotte | 0-8 | 1-11 |
NCAAF News
'Street agents' exploiting athletes in NIL deals, coaches warn
Coaches and other observers see a growing need to protect athletes by regulating middlemen in NIL deals.
1h
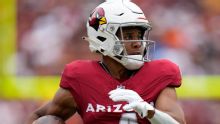
Rondale Moore dies at the age of 25
Scott Van Pelt reacts to the news that NFL WR Rondale Moore died at the age of 25 on Saturday
19h

2026 NFL draft: Execs, scouts, players on top prospects
We asked NFL execs, scouts and players to weigh in on the Raiders' No. 1 pick and the best prospects in 2026.
1d