
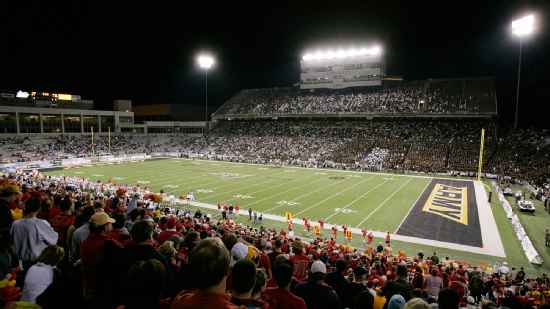
Duke Blue Devils @ Army Black Knights

5-1, 2-0 Away
44
5-1, 2-0 Away

1-5, 0-3 Home
3
1-5, 0-3 Home
Game Leaders


197
T. SirkQB
17/27, 1 TD
197
55
A. BradshawQB
2/6, 1 INT
55
78
J. DuncanRB
8 CAR, 2 TD
78

29
D. HarrisRB
4 CAR
29
58
J. BarnesWR
2 REC
58
37
K. WhiteTE
1 REC
37

1
T. BereLB
1
--
--
11
D. NormanLB
10 SOLO
11
11
A. KingLB
9 SOLO
11
Team Stats


458
Total Yards
168
0
Turnovers
3
25
1st Downs
12
5-50
Penalties
5-32
11/16
3rd Down
3/14
0/0
4th Down
2/3
30:30
Possession
29:30
Game Information
West Point, NY
Team Stats
 | | |
|---|---|---|
| 1st Downs | 25 | 12 |
| 3rd down efficiency | 11-16 | 3-14 |
| 4th down efficiency | 0-0 | 2-3 |
| Total Yards | 458 | 168 |
| Passing | 243 | 55 |
| Comp/Att | 20/30 | 2/6 |
| Yards per pass | 8.1 | 9.2 |
| Interceptions thrown | 0 | 1 |
| Rushing | 215 | 113 |
| Rushing Attempts | 48 | 49 |
| Yards per rush | 4.5 | 2.3 |
| Penalties | 5-50 | 5-32 |
| Turnovers | 0 | 3 |
| Fumbles lost | 0 | 2 |
| Interceptions thrown | 0 | 1 |
| Possession | 30:30 | 29:30 |
2025 Standings
FBS
| Atlantic Coast Conference | CONF | OVR |
|---|---|---|
| Virginia | 7-1 | 11-3 |
| SMU | 6-2 | 9-4 |
| Miami | 6-2 | 13-3 |
| Pittsburgh | 6-2 | 8-5 |
| Georgia Tech | 6-2 | 9-4 |
| Duke | 6-2 | 9-5 |
| NC State | 4-4 | 8-5 |
| California | 4-4 | 7-6 |
| Clemson | 4-4 | 7-6 |
| Louisville | 4-4 | 9-4 |
| Wake Forest | 4-4 | 9-4 |
| Stanford | 3-5 | 4-8 |
| Florida State | 2-6 | 5-7 |
| North Carolina | 2-6 | 4-8 |
| Virginia Tech | 2-6 | 3-9 |
| Boston College | 1-7 | 2-10 |
| Syracuse | 1-7 | 3-9 |
FBS
| American Conference | CONF | OVR |
|---|---|---|
| Tulane | 7-1 | 11-3 |
| North Texas | 7-1 | 12-2 |
| Navy | 7-1 | 11-2 |
| East Carolina | 6-2 | 9-4 |
| South Florida | 6-2 | 9-4 |
| Army | 4-4 | 7-6 |
| Memphis | 4-4 | 8-5 |
| UTSA | 4-4 | 7-6 |
| Temple | 3-5 | 5-7 |
| Florida Atlantic | 3-5 | 4-8 |
| Rice | 2-6 | 5-8 |
| UAB | 2-6 | 4-8 |
| Tulsa | 1-7 | 4-8 |
| Charlotte | 0-8 | 1-11 |
NCAAF News

Why Louis Riddick considers Jeremiyah Love a massive difference-maker
Louis Riddick breaks down why Jeremiyah Love is the biggest offensive difference-maker in the 2026 NFL draft.
3h

'Street agents' exploiting athletes in NIL deals, coaches warn
Coaches and other observers see a growing need to protect athletes by regulating middlemen in NIL deals.
4h
Rondale Moore dies at the age of 25
Scott Van Pelt reacts to the news that NFL WR Rondale Moore died at the age of 25 on Saturday
1d