
Temple Owls @ Louisville Cardinals

3-5, 1-3 Away
17
3-5, 1-3 Away
Final
| 1 | 2 | 3 | 4 | T | |
|---|---|---|---|---|---|
TEM | 14 | 3 | 0 | 0 | 17 |
LOU | 14 | 17 | 14 | 0 | 45 |

9-0, 6-0 Home
45
9-0, 6-0 Home
Game Leaders


Team Stats


309
Total Yards
508
4
Turnovers
0
17
1st Downs
25
6-40
Penalties
10-86
2/10
3rd Down
4/11
1/3
4th Down
1/1
27:14
Possession
32:46
Game Information
Louisville, KY
Team Stats
 | | |
|---|---|---|
| 1st Downs | 17 | 25 |
| 3rd down efficiency | 2-10 | 4-11 |
| 4th down efficiency | 1-3 | 1-1 |
| Total Yards | 309 | 508 |
| Passing | 54 | 338 |
| Comp/Att | 6/16 | 22/33 |
| Yards per pass | 3.4 | 10.2 |
| Interceptions thrown | 0 | 0 |
| Rushing | 255 | 170 |
| Rushing Attempts | 43 | 32 |
| Yards per rush | 5.9 | 5.3 |
| Penalties | 6-40 | 10-86 |
| Turnovers | 4 | 0 |
| Fumbles lost | 4 | 0 |
| Interceptions thrown | 0 | 0 |
| Possession | 27:14 | 32:46 |
2025 Standings
FBS
| American Conference | CONF | OVR |
|---|---|---|
| Tulane | 7-1 | 11-3 |
| North Texas | 7-1 | 12-2 |
| Navy | 7-1 | 11-2 |
| East Carolina | 6-2 | 9-4 |
| South Florida | 6-2 | 9-4 |
| Army | 4-4 | 7-6 |
| Memphis | 4-4 | 8-5 |
| UTSA | 4-4 | 7-6 |
| Temple | 3-5 | 5-7 |
| Florida Atlantic | 3-5 | 4-8 |
| Rice | 2-6 | 5-8 |
| UAB | 2-6 | 4-8 |
| Tulsa | 1-7 | 4-8 |
| Charlotte | 0-8 | 1-11 |
| Atlantic Coast Conference | CONF | OVR |
|---|---|---|
| Virginia | 7-1 | 11-3 |
| SMU | 6-2 | 9-4 |
| Miami | 6-2 | 13-3 |
| Pittsburgh | 6-2 | 8-5 |
| Georgia Tech | 6-2 | 9-4 |
| Duke | 6-2 | 9-5 |
| NC State | 4-4 | 8-5 |
| California | 4-4 | 7-6 |
| Clemson | 4-4 | 7-6 |
| Louisville | 4-4 | 9-4 |
| Wake Forest | 4-4 | 9-4 |
| Stanford | 3-5 | 4-8 |
| Florida State | 2-6 | 5-7 |
| North Carolina | 2-6 | 4-8 |
| Virginia Tech | 2-6 | 3-9 |
| Boston College | 1-7 | 2-10 |
| Syracuse | 1-7 | 3-9 |
NCAAF News

What title stories stack up to Indiana's turnaround? We asked our experts
Was Indiana's title the greatest story in sports history? There might never be an objective answer, but we polled our experts for comparable arguments in other sports.
4h
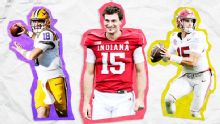
2026 NFL draft QB rankings: Mendoza, Simpson, Chambliss
Who are the best quarterbacks in the 2026 class? We sized up the top 12, starting with Fernando Mendoza and Ty Simpson.
1h
Sources: OT Seaton joining LSU, leaves Colorado
Sources: OT Seaton joining LSU, leaves Colorado
12h