
Tulsa Golden Hurricane @ SMU Mustangs

2-3, 0-1 American
37
2-3, 0-1 American

6-0, 2-0 American
43
6-0, 2-0 American
Game Leaders


Team Stats


500
Total Yards
440
3
Turnovers
1
22
1st Downs
25
10-97
Penalties
9-80
7/16
3rd Down
5/20
0/0
4th Down
6/7
29:21
Possession
30:39
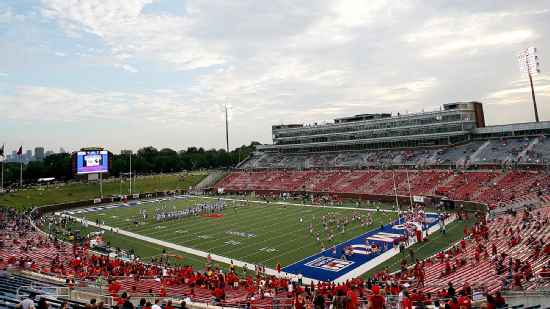
Game Information
Dallas, TX
Team Stats
 | | |
|---|---|---|
| 1st Downs | 22 | 25 |
| 3rd down efficiency | 7-16 | 5-20 |
| 4th down efficiency | 0-0 | 6-7 |
| Total Yards | 500 | 440 |
| Passing | 346 | 310 |
| Comp/Att | 23/41 | 24/42 |
| Yards per pass | 8.4 | 7.4 |
| Interceptions thrown | 3 | 0 |
| Rushing | 154 | 130 |
| Rushing Attempts | 35 | 49 |
| Yards per rush | 4.4 | 2.7 |
| Penalties | 10-97 | 9-80 |
| Turnovers | 3 | 1 |
| Fumbles lost | 0 | 1 |
| Interceptions thrown | 3 | 0 |
| Possession | 29:21 | 30:39 |
TLSA @ SMU Videos
Tulsa's Rainey misses game-winning FG in 2OT
SMU answers Tulsa in OT with quick rushing TD by Jones
Tulsa's Johnson dives to catch TD in OT
2025 Standings
FBS
| American Conference | CONF | OVR |
|---|---|---|
| Tulane | 7-1 | 11-3 |
| North Texas | 7-1 | 12-2 |
| Navy | 7-1 | 11-2 |
| East Carolina | 6-2 | 9-4 |
| South Florida | 6-2 | 9-4 |
| Army | 4-4 | 7-6 |
| Memphis | 4-4 | 8-5 |
| UTSA | 4-4 | 7-6 |
| Temple | 3-5 | 5-7 |
| Florida Atlantic | 3-5 | 4-8 |
| Rice | 2-6 | 5-8 |
| UAB | 2-6 | 4-8 |
| Tulsa | 1-7 | 4-8 |
| Charlotte | 0-8 | 1-11 |
| Atlantic Coast Conference | CONF | OVR |
|---|---|---|
| Virginia | 7-1 | 11-3 |
| SMU | 6-2 | 9-4 |
| Miami | 6-2 | 13-3 |
| Pittsburgh | 6-2 | 8-5 |
| Georgia Tech | 6-2 | 9-4 |
| Duke | 6-2 | 9-5 |
| NC State | 4-4 | 8-5 |
| California | 4-4 | 7-6 |
| Clemson | 4-4 | 7-6 |
| Louisville | 4-4 | 9-4 |
| Wake Forest | 4-4 | 9-4 |
| Stanford | 3-5 | 4-8 |
| Florida State | 2-6 | 5-7 |
| North Carolina | 2-6 | 4-8 |
| Virginia Tech | 2-6 | 3-9 |
| Boston College | 1-7 | 2-10 |
| Syracuse | 1-7 | 3-9 |
NCAAF News

Stephen A. to NCAA: Leave Chambliss alone, 'let him play'
Stephen A. Smith reacts to the news that Trinidad Chambliss has been granted a sixth year of eligibility for Ole Miss.
6h

Source: Cowboys to hire SMU DC Symons as new ILB coach
The Dallas Cowboys are set to name SMU defensive coordinator Scott Symons as their new inside linebackers coach, a source confirmed to ESPN.
5h

Big Ten details 24-team CFP plan with no league title games
The Big Ten is circulating an internal document that lays out what a 24-team CFP would look like, including the elimination of conference championship games, a 23+1 selection model and an additional weekend of on-campus CFP home games.
4h