
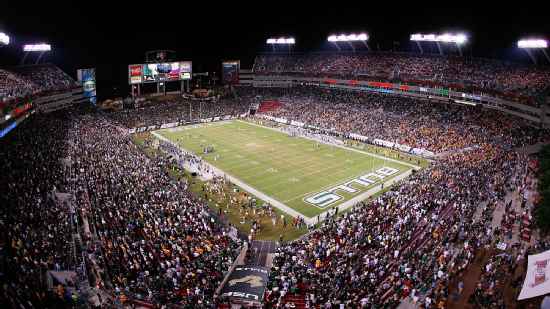
East Carolina Pirates @ South Florida Bulls

1-2, 1-1 American
44
1-2, 1-1 American
Final
| 1 | 2 | 3 | 4 | T | |
|---|---|---|---|---|---|
| 17 | 14 | 7 | 6 | 44 | |
| 7 | 10 | 0 | 7 | 24 |

1-3, 0-2 American
24
1-3, 0-2 American
Game Leaders


Team Stats


432
Total Yards
398
0
Turnovers
2
21
1st Downs
22
3-45
Penalties
5-50
8/16
3rd Down
5/13
2/2
4th Down
0/3
35:36
Possession
24:24
Game Information
Tampa, FL
Team Stats
 | | |
|---|---|---|
| 1st Downs | 21 | 22 |
| 3rd down efficiency | 8-16 | 5-13 |
| 4th down efficiency | 2-2 | 0-3 |
| Total Yards | 432 | 398 |
| Passing | 222 | 306 |
| Comp/Att | 17/26 | 28/38 |
| Yards per pass | 8.5 | 8.1 |
| Interceptions thrown | 0 | 0 |
| Rushing | 210 | 92 |
| Rushing Attempts | 47 | 34 |
| Yards per rush | 4.5 | 2.7 |
| Penalties | 3-45 | 5-50 |
| Turnovers | 0 | 2 |
| Fumbles lost | 0 | 2 |
| Interceptions thrown | 0 | 0 |
| Possession | 35:36 | 24:24 |
2025 Standings
FBS
| American Conference | CONF | OVR |
|---|---|---|
| Tulane | 7-1 | 11-3 |
| North Texas | 7-1 | 12-2 |
| Navy | 7-1 | 11-2 |
| East Carolina | 6-2 | 9-4 |
| South Florida | 6-2 | 9-4 |
| Army | 4-4 | 7-6 |
| Memphis | 4-4 | 8-5 |
| UTSA | 4-4 | 7-6 |
| Temple | 3-5 | 5-7 |
| Florida Atlantic | 3-5 | 4-8 |
| Rice | 2-6 | 5-8 |
| UAB | 2-6 | 4-8 |
| Tulsa | 1-7 | 4-8 |
| Charlotte | 0-8 | 1-11 |
NCAAF News

Source: Ducks' Isaiah World to miss NFL combine with torn ACL
Oregon LT Isaiah World suffered a torn ACL in his left knee during the CFP semifinal loss to Indiana and will not attend the NFL draft combine, a source told ESPN.
1h

Why Finebaum says Lane Kiffin won the college football offseason
Paul Finebaum and Louis Riddick break down why Lane Kiffin and LSU won the offseason in college football.
2h

Why Finebaum expects improvement from Texas, Manning next season
Louis Riddick and Paul Finebaum break down their expectations for Arch Manning and the Texas Longhorns.
3h