
Stanford Cardinal @ Washington Huskies

8-8, 2-2 Pac-12
61
8-8, 2-2 Pac-12
Final
| 1 | 2 | T | |
|---|---|---|---|
STAN | 22 | 39 | 61 |
WASH | 41 | 53 | 94 |

11-5, 2-3 Pac-12
94
11-5, 2-3 Pac-12
Game Leaders


Team Stats


41% (19-46)
Field Goal %
49% (37-76)
14% (1-7)
Three Point %
32% (6-19)
59% (22-37)
Free Throw %
67% (14-21)
20
Turnovers
10
33
Rebounds
42
0
Largest Lead
36
Game Information
Seattle, WA
Team Stats
 | | |
|---|---|---|
| FG | 19-46 | 37-76 |
| Field Goal % | 41 | 49 |
| 3PT | 1-7 | 6-19 |
| Three Point % | 14 | 32 |
| FT | 22-37 | 14-21 |
| Free Throw % | 59 | 67 |
| Rebounds | 33 | 42 |
| Offensive Rebounds | 11 | 20 |
| Defensive Rebounds | 22 | 22 |
| Assists | 10 | 19 |
| Steals | 5 | 10 |
| Blocks | 2 | 6 |
| Total Turnovers | 20 | 10 |
| Points Off Turnovers | 0 | 0 |
| Fast Break Points | 0 | 0 |
| Points in Paint | 0 | 0 |
| Fouls | 21 | 28 |
| Technical Fouls | 0 | 0 |
| Flagrant Fouls | 0 | 0 |
| Largest Lead | 0 | 36 |
2025-26 Standings
NCAA Division I
| Atlantic Coast Conference | CONF | GB | OVR |
|---|---|---|---|
| Duke | 13-1 | - | 24-2 |
| Virginia | 11-2 | 1.5 | 23-3 |
| Miami | 10-3 | 2.5 | 21-5 |
| Clemson | 10-4 | 3 | 20-7 |
| NC State | 10-4 | 3 | 19-8 |
| North Carolina | 8-5 | 4.5 | 20-6 |
| Louisville | 8-5 | 4.5 | 19-7 |
| SMU | 7-6 | 5.5 | 18-8 |
| California | 6-7 | 6.5 | 18-8 |
| Florida State | 6-7 | 6.5 | 13-13 |
| Virginia Tech | 6-8 | 7 | 17-10 |
| Syracuse | 6-8 | 7 | 15-12 |
| Stanford | 5-8 | 7.5 | 16-10 |
| Wake Forest | 5-8 | 7.5 | 14-12 |
| Notre Dame | 3-10 | 9.5 | 12-14 |
| Boston College | 2-11 | 10.5 | 9-17 |
| Pittsburgh | 2-11 | 10.5 | 9-17 |
| Georgia Tech | 2-12 | 11 | 11-16 |
| Big Ten Conference | CONF | GB | OVR |
|---|---|---|---|
| Michigan | 15-1 | - | 25-1 |
| Illinois | 13-3 | 2 | 22-5 |
| Nebraska | 11-4 | 3.5 | 22-4 |
| Purdue | 11-4 | 3.5 | 21-5 |
| Michigan State | 11-4 | 3.5 | 21-5 |
| Wisconsin | 10-5 | 4.5 | 18-8 |
| Iowa | 9-6 | 5.5 | 19-7 |
| Ohio State | 9-6 | 5.5 | 17-9 |
| UCLA | 9-6 | 5.5 | 17-9 |
| Indiana | 8-7 | 6.5 | 17-9 |
| USC | 7-8 | 7.5 | 18-8 |
| Washington | 5-10 | 9.5 | 13-13 |
| Minnesota | 5-10 | 9.5 | 12-14 |
| Rutgers | 4-11 | 10.5 | 11-15 |
| Maryland | 3-12 | 11.5 | 10-16 |
| Northwestern | 3-13 | 12 | 11-16 |
| Oregon | 2-13 | 12.5 | 9-17 |
| Penn State | 2-14 | 13 | 11-16 |
Men's College Basketball News

NCAA's Charlie Baker reiterates support for expanded tournaments
Charlie Baker reiterated Thursday that he supports an expanded NCAA tournament but would not commit on whether it would happen in 2027.
3h
Joe Lunardi's men's Bracketology March Madness watch guide
What's at stake for South Florida, Liberty, High Point and more tonight.
4h
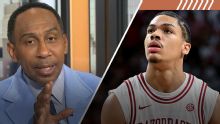
Stephen A. astonished by Perk's Darius Acuff Jr. comments
Stephen A. Smith is left stunned after Kendrick Perkins says that Darius Acuff Jr. should be the No. 1 pick in the NBA draft.
4h