
Boston Celtics @ Indiana Pacers

51-22, 22-14 Away
100
51-22, 22-14 Away

33-42, 20-16 Home
107
33-42, 20-16 Home
Game Leaders


Team Stats


55% (34-62)
Field Goal %
55% (42-77)
36% (4-11)
Three Point %
40% (6-15)
78% (28-36)
Free Throw %
77% (17-22)
15
Turnovers
15
34
Rebounds
42
10
Largest Lead
10
Game Information
Indianapolis, IN
Referee:Ed Malloy
Referee:Haywoode Workman
Referee:Rodney Mott
Team Stats
 | | |
|---|---|---|
| FG | 34-62 | 42-77 |
| Field Goal % | 55 | 55 |
| 3PT | 4-11 | 6-15 |
| Three Point % | 36 | 40 |
| FT | 28-36 | 17-22 |
| Free Throw % | 78 | 77 |
| Rebounds | 34 | 42 |
| Offensive Rebounds | 3 | 8 |
| Defensive Rebounds | 26 | 28 |
| Assists | 19 | 18 |
| Steals | 5 | 7 |
| Blocks | 3 | 4 |
| Total Turnovers | 15 | 15 |
| Points Conceded Off Turnovers | 16 | 21 |
| Fast Break Points | 10 | 8 |
| Points in Paint | 42 | 42 |
| Fouls | 21 | 22 |
| Technical Fouls | 2 | 1 |
| Flagrant Fouls | 0 | 0 |
| Largest Lead | 10 | 10 |
Matchups
2025-26 Standings
NBA News

Tim Hardaway Jr. excited to follow in his dad's footsteps
Tim Hardaway Jr. excited to follow in his dad's footsteps
2h
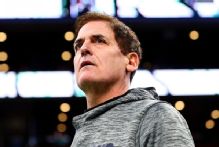
Cuban accuses Mavs owner of freezing him out in proposed move
The Dallas Morning News reported Wednesday that Mark Cuban alleges Mavericks governor Patrick Dumont has engaged in "adversarial business practices" in a proposed move of the club out of downtown.
1h
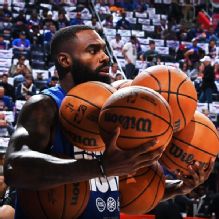
Tim Hardaway Jr.: Prayers answered with deal to join Heat
The Heat formally introduced part of the family Wednesday, with Tim Hardaway Jr. getting his welcome-back-to-Miami news conference -- and getting handed a No. 10 Heat jersey, only this one with "Jr." after the family surname on the back.
1h