
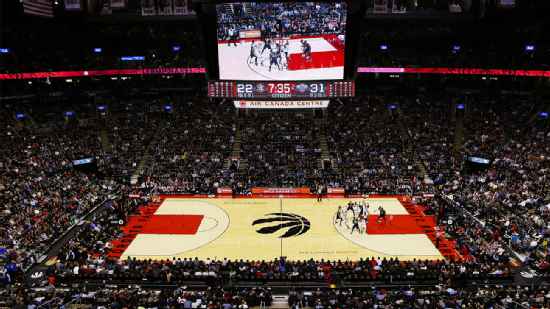
Oklahoma City Thunder @ Toronto Raptors

26-7, 9-4 Away
104
26-7, 9-4 Away

12-22, 8-7 Home
92
12-22, 8-7 Home
Game Leaders


Team Stats


49% (38-77)
Field Goal %
45% (34-76)
27% (6-22)
Three Point %
35% (8-23)
92% (22-24)
Free Throw %
76% (16-21)
16
Turnovers
17
46
Rebounds
42
Game Information
Toronto, ON
Referee:James Capers
Referee:Tre Maddox
Referee:Gary Zielinski
Team Stats
 | | |
|---|---|---|
| FG | 38-77 | 34-76 |
| Field Goal % | 49 | 45 |
| 3PT | 6-22 | 8-23 |
| Three Point % | 27 | 35 |
| FT | 22-24 | 16-21 |
| Free Throw % | 92 | 76 |
| Rebounds | 46 | 42 |
| Offensive Rebounds | 12 | 7 |
| Defensive Rebounds | 29 | 24 |
| Assists | 24 | 28 |
| Steals | 8 | 7 |
| Blocks | 4 | 3 |
| Total Turnovers | 16 | 17 |
| Points Conceded Off Turnovers | 23 | 16 |
| Fast Break Points | 17 | 9 |
| Points in Paint | 46 | 32 |
| Fouls | 20 | 18 |
| Technical Fouls | 1 | 2 |
| Flagrant Fouls | 0 | 0 |
Matchups
2025-26 Standings
Western Conference
| Northwest | W | L | PCT | GB | STRK |
|---|---|---|---|---|---|
| Oklahoma City | 64 | 18 | .780 | - | L2 |
| Denver | 54 | 28 | .659 | 10 | W12 |
| Minnesota | 49 | 33 | .598 | 15 | W2 |
| Portland | 42 | 40 | .512 | 22 | W2 |
| Utah | 22 | 60 | .268 | 42 | L1 |
Eastern Conference
| Atlantic | W | L | PCT | GB | STRK |
|---|---|---|---|---|---|
| Boston | 56 | 26 | .683 | - | W2 |
| New York | 53 | 29 | .646 | 3 | L1 |
| Toronto | 46 | 36 | .561 | 10 | W1 |
| Philadelphia | 45 | 37 | .549 | 11 | W2 |
| Brooklyn | 20 | 62 | .244 | 36 | L3 |
NBA News

Reaves: 'Nothing but love and respect' for LeBron
Reaves: 'Nothing but love and respect' for LeBron
2h
2026 NBA buzz: Latest summer league, free agency, trade updates
We're tracking deals, trades and buzz across the NBA, including the latest on AJ Dybantsa and other rookies at summer league.
3h
Toronto Raptors vs. Indiana Pacers: Game Highlights
Toronto Raptors vs. Indiana Pacers: Game Highlights
3h