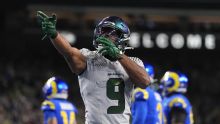
Seattle Seahawks @ New York Giants
Game Leaders
Team Stats
187
Total Yards
523
1
Turnovers
0
13
1st Downs
27
2-29
Penalties
5-56
1/11
3rd Down
3/8
0/0
4th Down
0/0
0/2
Red Zone
3/6
23:32
Possession
36:28
Game Information
East Rutherford, NJ
1st Quarter
Touchdown
11:37 - 1st
0
SEA
6
NYG
TD
4 plays, 91 yards, 2:14
Extra Point
11:21 - 1st
0
SEA
7
NYG
PAT
4 plays, 91 yards, 2:14
Field Goal
7:14 - 1st
3
SEA
7
NYG
Field Goal
10 plays, 54 yards, 4:12
Touchdown
3:51 - 1st
3
SEA
13
NYG
TD
6 plays, 75 yards, 3:30
Extra Point
3:39 - 1st
3
SEA
14
NYG
PAT
6 plays, 75 yards, 3:30
2nd Quarter
Field Goal
14:55 - 2nd
3
SEA
17
NYG
Field Goal
5 plays, 48 yards, 2:14
Touchdown
7:31 - 2nd
3
SEA
23
NYG
TD
11 plays, 73 yards, 6:24
Extra Point
7:23 - 2nd
3
SEA
24
NYG
PAT
11 plays, 73 yards, 6:24
Field Goal
0:52 - 2nd
3
SEA
27
NYG
Field Goal
10 plays, 63 yards, 4:11
Field Goal
0:07 - 2nd
6
SEA
27
NYG
Field Goal
6 plays, 51 yards, 0:44
3rd Quarter
Touchdown
12:06 - 3rd
6
SEA
33
NYG
TD
6 plays, 80 yards, 3:02
Extra Point
11:58 - 3rd
6
SEA
34
NYG
PAT
6 plays, 80 yards, 3:02
Field Goal
1:43 - 3rd
6
SEA
37
NYG
Field Goal
7 plays, 15 yards, 4:16
4th Quarter
Touchdown
9:34 - 4th
6
SEA
43
NYG
TD
7 plays, 77 yards, 4:16
Extra Point
9:25 - 4th
6
SEA
44
NYG
PAT
7 plays, 77 yards, 4:16
Data is currently unavailable.
2025 Standings
National Football Conference
| NFC West | W | L | T | PCT | PF | PA |
|---|---|---|---|---|---|---|
| Seattle | 14 | 3 | 0 | .824 | 483 | 292 |
| Los Angeles | 12 | 5 | 0 | .706 | 518 | 346 |
| San Francisco | 12 | 5 | 0 | .706 | 437 | 371 |
| Arizona | 3 | 14 | 0 | .176 | 355 | 488 |
| NFC East | W | L | T | PCT | PF | PA |
|---|---|---|---|---|---|---|
| Philadelphia | 11 | 6 | 0 | .647 | 379 | 325 |
| Dallas | 7 | 9 | 1 | .441 | 471 | 511 |
| Washington | 5 | 12 | 0 | .294 | 356 | 451 |
| New York | 4 | 13 | 0 | .235 | 381 | 439 |
NFL News

Bad Bunny meets Super Bowl LX: Musical guide to NFL postseason
Bad Bunny's music provides a soundtrack for every team in the 2026 NFL playoffs.
1h

Erin Dolan's favorite Super Bowl prop bet
Erin Dolan breaks down her top betting prop for Super Bowl LX.
1h

How Mike Vrabel's ritual ignited the Patriots' Super Bowl run
High-fives, headlocks and full sprints: This is how the former All-Pro linebacker molded the franchise in his image.
4h
GAMBLING PROBLEM? CALL 1-800-GAMBLER, (800) 327-5050 or visit gamblinghelplinema.org (MA). Call 877-8-HOPENY/text HOPENY (467369) (NY). Please Gamble Responsibly. 888-789-7777/visit ccpg.org (CT), or visit www.mdgamblinghelp.org (MD). 21+ and present in most states. (18+ DC/KY/NH/WY). Void in ONT/OR/NH. Eligibility restrictions apply. On behalf of Boot Hill Casino & Resort (KS). Terms: sportsbook.draftkings.com/promos.
Copyright: © 2026 ESPN Enterprises, Inc. All rights reserved.


