
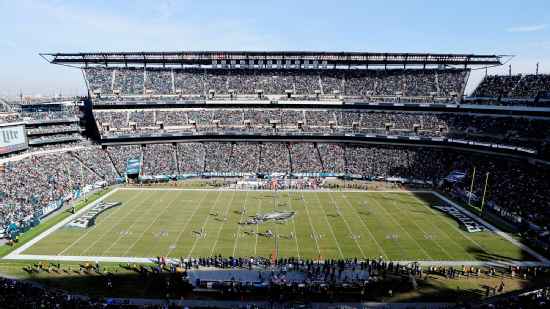
Jacksonville Jaguars @ Philadelphia Eagles

4-3, 1-3 Away
13
4-3, 1-3 Away

4-4, 2-2 Home
6
4-4, 2-2 Home
Game Leaders


87
D. GarrardQB
10/17
87
161
D. McNabbQB
18/34
161
103
F. TaylorRB
15 CAR, 1 TD
103
38
B. WestbrookRB
13 CAR
38

32
M. JonesWR
2 REC
32
68
B. WestbrookRB
8 REC
68

1
B. McCrayDE
1
0.5
D. JonesLB
0.5
9
D. SmithLB
6 SOLO
9

11
B. DawkinsS
6 SOLO
11
Team Stats


285
Total Yards
227
1
Turnovers
0
16
1st Downs
14
5-44
Penalties
8-50
4/14
3rd Down
4/14
2/3
4th Down
0/1
1/3
Red Zone
0/2
36:51
Possession
23:09
Game Information
Philadelphia, PA
Referee:Ed Hochuli
Team Stats
 | | |
|---|---|---|
| 1st Downs | 16 | 14 |
| Passing 1st downs | 3 | 9 |
| Rushing 1st downs | 13 | 4 |
| 1st downs from penalties | 0 | 1 |
| 3rd down efficiency | 4-14 | 4-14 |
| 4th down efficiency | 2-3 | 0-1 |
| Total Plays | 64 | 58 |
| Total Yards | 285 | 227 |
| Total Drives | 11 | 11 |
| Yards per Play | 4.5 | 3.9 |
| Passing | 76 | 142 |
| Comp/Att | 10/17 | 18/34 |
| Yards per pass | 4.2 | 3.7 |
| Interceptions thrown | 0 | 0 |
| Sacks-Yards Lost | 1-11 | 4-19 |
| Rushing | 209 | 85 |
| Rushing Attempts | 46 | 20 |
| Yards per rush | 4.5 | 4.3 |
| Red Zone (Made-Att) | 1-3 | 0-2 |
| Penalties | 5-44 | 8-50 |
| Turnovers | 1 | 0 |
| Fumbles lost | 1 | 0 |
| Interceptions thrown | 0 | 0 |
| Defensive / Special Teams TDs | 0 | 0 |
| Possession | 36:51 | 23:09 |
2025 Standings
American Football Conference
| AFC South | W | L | T | PCT | PF | PA |
|---|---|---|---|---|---|---|
| Jacksonville | 13 | 4 | 0 | .765 | 474 | 336 |
| Houston | 12 | 5 | 0 | .706 | 404 | 295 |
| Indianapolis | 8 | 9 | 0 | .471 | 466 | 412 |
| Tennessee | 3 | 14 | 0 | .176 | 284 | 478 |
National Football Conference
| NFC East | W | L | T | PCT | PF | PA |
|---|---|---|---|---|---|---|
| Philadelphia | 11 | 6 | 0 | .647 | 379 | 325 |
| Dallas | 7 | 9 | 1 | .441 | 471 | 511 |
| Washington | 5 | 12 | 0 | .294 | 356 | 451 |
| New York | 4 | 13 | 0 | .235 | 381 | 439 |
NFL News
Should Lamar Jackson, Ravens be Super Bowl favorites?
Should Lamar Jackson, Ravens be Super Bowl favorites?
3h

Foxworth excited to see how Giants evolve under John Harbaugh
Foxworth excited to see how Giants evolve under John Harbaugh
2h
Fantasy football cheat sheets: PPR, non-PPR, depth charts
Our collection of downloadable, printable cheat sheets for the 2026 fantasy football season, including PPR, non-PPR and dynasty/keeper leagues.
4h