
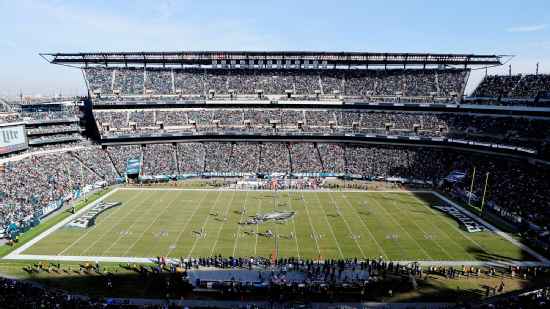
Atlanta Falcons @ Philadelphia Eagles

4-3, 1-3 Away
14
4-3, 1-3 Away

4-3, 3-1 Home
27
4-3, 3-1 Home
Game Leaders


Team Stats


335
Total Yards
432
3
Turnovers
1
19
1st Downs
24
6-51
Penalties
7-70
6/16
3rd Down
3/12
1/2
4th Down
0/0
1/2
Red Zone
2/4
27:39
Possession
32:21
Game Information
Philadelphia, PA
Referee:Jerome Boger
Team Stats
 | | |
|---|---|---|
| 1st Downs | 19 | 24 |
| Passing 1st downs | 13 | 11 |
| Rushing 1st downs | 3 | 11 |
| 1st downs from penalties | 3 | 2 |
| 3rd down efficiency | 6-16 | 3-12 |
| 4th down efficiency | 1-2 | 0-0 |
| Total Plays | 70 | 68 |
| Total Yards | 335 | 432 |
| Total Drives | 12 | 14 |
| Yards per Play | 4.8 | 6.4 |
| Passing | 258 | 240 |
| Comp/Att | 23/44 | 19/34 |
| Yards per pass | 5.6 | 6.7 |
| Interceptions thrown | 2 | 0 |
| Sacks-Yards Lost | 2-19 | 2-13 |
| Rushing | 77 | 192 |
| Rushing Attempts | 24 | 32 |
| Yards per rush | 3.2 | 6.0 |
| Red Zone (Made-Att) | 1-2 | 2-4 |
| Penalties | 6-51 | 7-70 |
| Turnovers | 3 | 1 |
| Fumbles lost | 1 | 1 |
| Interceptions thrown | 2 | 0 |
| Defensive / Special Teams TDs | 0 | 0 |
| Possession | 27:39 | 32:21 |
2025 Standings
National Football Conference
| NFC South | W | L | T | PCT | PF | PA |
|---|---|---|---|---|---|---|
| Carolina | 8 | 9 | 0 | .471 | 311 | 380 |
| Tampa Bay | 8 | 9 | 0 | .471 | 380 | 411 |
| Atlanta | 8 | 9 | 0 | .471 | 353 | 401 |
| New Orleans | 6 | 11 | 0 | .353 | 306 | 383 |
| NFC East | W | L | T | PCT | PF | PA |
|---|---|---|---|---|---|---|
| Philadelphia | 11 | 6 | 0 | .647 | 379 | 325 |
| Dallas | 7 | 9 | 1 | .441 | 471 | 511 |
| Washington | 5 | 12 | 0 | .294 | 356 | 451 |
| New York | 4 | 13 | 0 | .235 | 381 | 439 |
NFL News
Fantasy football buzz: Three WRs being undervalued that you should be targeting
Matt Bowen breaks down three wide receivers on his radar who are being undervalued at this point of summer.
4h

Why RC has a problem with Jalen Hurts falling to 6th tier in QB survey
Why RC has a problem with Jalen Hurts falling to 6th tier in QB survey
5h

Who are the current NFL team owners?
NFL team owners carry a variety of reputations in the public eye. Who is in charge of your favorite franchises? Check out this list for more details.
6h