
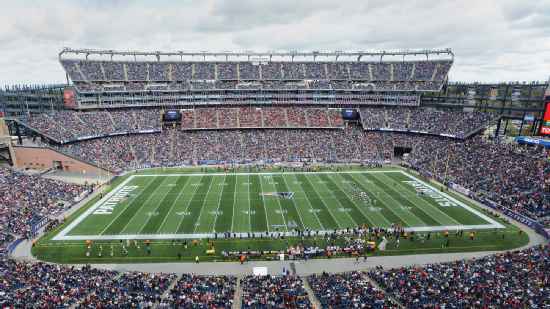
Cincinnati Bengals @ New England Patriots

0-1, 0-1 Away
24
0-1, 0-1 Away

1-0, 1-0 Home
38
1-0, 1-0 Home
Game Leaders


345
C. PalmerQB
34/50, 2 TD, 1 INT
345

258
T. BradyQB
25/35, 3 TD
258

43
C. BensonRB
15 CAR, 1 TD
43
71
F. TaylorRB
14 CAR
71
159
C. JohnsonWR
12 REC, 1 TD
159

64
W. WelkerWR
8 REC, 2 TD
64

--
None
--

0.5
T. Banta-CainLB
0.5
10
K. RiversLB
7 SOLO
10

16
P. ChungS
12 SOLO
16
Team Stats


428
Total Yards
376
2
Turnovers
0
26
1st Downs
20
2-5
Penalties
6-30
8/15
3rd Down
9/13
3/3
4th Down
0/1
2/2
Red Zone
3/5
31:50
Possession
28:10
Game Information
Foxborough, MA
Referee:Carl Cheffers
Team Stats
 | | |
|---|---|---|
| 1st Downs | 26 | 20 |
| Passing 1st downs | 21 | 13 |
| Rushing 1st downs | 5 | 7 |
| 1st downs from penalties | 0 | 0 |
| 3rd down efficiency | 8-15 | 9-13 |
| 4th down efficiency | 3-3 | 0-1 |
| Total Plays | 76 | 58 |
| Total Yards | 428 | 376 |
| Total Drives | 11 | 9 |
| Yards per Play | 5.6 | 6.5 |
| Passing | 341 | 258 |
| Comp/Att | 34/50 | 25/35 |
| Yards per pass | 6.7 | 7.4 |
| Interceptions thrown | 1 | 0 |
| Sacks-Yards Lost | 1-4 | 0-0 |
| Rushing | 87 | 118 |
| Rushing Attempts | 25 | 23 |
| Yards per rush | 3.5 | 5.1 |
| Red Zone (Made-Att) | 2-2 | 3-5 |
| Penalties | 2-5 | 6-30 |
| Turnovers | 2 | 0 |
| Fumbles lost | 1 | 0 |
| Interceptions thrown | 1 | 0 |
| Defensive / Special Teams TDs | 0 | 3 |
| Possession | 31:50 | 28:10 |
2025 Standings
American Football Conference
| AFC North | W | L | T | PCT | PF | PA |
|---|---|---|---|---|---|---|
| Pittsburgh | 10 | 7 | 0 | .588 | 397 | 387 |
| Baltimore | 8 | 9 | 0 | .471 | 424 | 398 |
| Cincinnati | 6 | 11 | 0 | .353 | 414 | 492 |
| Cleveland | 5 | 12 | 0 | .294 | 279 | 379 |
| AFC East | W | L | T | PCT | PF | PA |
|---|---|---|---|---|---|---|
| New England | 14 | 3 | 0 | .824 | 490 | 320 |
| Buffalo | 12 | 5 | 0 | .706 | 481 | 365 |
| Miami | 7 | 10 | 0 | .412 | 347 | 424 |
| New York | 3 | 14 | 0 | .176 | 300 | 503 |
NFL News
Execs, coaches, scouts rank top NFL offensive tackles for 2026
A new No. 1 OT in the league? Two blockers from the same team in the top 10? We canvassed NFL decision-makers to rank the NFL's best tackles for 2026.
9h
Did the Seahawks get better, worse or stay the same for 2026?
After some notable departures, let's look at key positions ahead of the 2026 season.
10h
How high should Cam Skattebo be drafted?
How high should Cam Skattebo be drafted?
19h