
Atlanta Falcons @ New York Giants
NFC WILD CARD PLAYOFF

10-6, 4-4 Away
2
10-6, 4-4 Away

9-7, 4-4 Home
24
9-7, 4-4 Home
Game Leaders


199
M. RyanQB
24/41
199
277
E. ManningQB
23/32, 3 TD
277
41
M. TurnerRB
15 CAR
41
92
B. JacobsRB
14 CAR
92
64
J. JonesWR
7 REC
64
115
H. NicksWR
6 REC, 2 TD
115
1
J. AbrahamLB
1
1
R. BernardDT
1
12
C. LoftonLB
9 SOLO
12
9
A. RolleS
6 SOLO
9
Team Stats


247
Total Yards
442
0
Turnovers
0
14
1st Downs
19
3-15
Penalties
7-73
4/14
3rd Down
8/15
0/3
4th Down
1/1
0/1
Red Zone
1/3
25:26
Possession
34:34
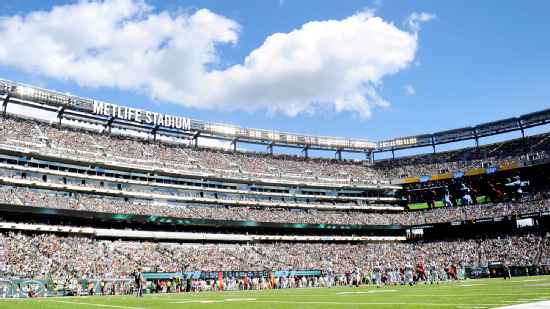
Game Information
East Rutherford, NJ
Team Stats
 | | |
|---|---|---|
| 1st Downs | 14 | 19 |
| Passing 1st downs | 9 | 11 |
| Rushing 1st downs | 4 | 8 |
| 1st downs from penalties | 1 | 0 |
| 3rd down efficiency | 4-14 | 8-15 |
| 4th down efficiency | 0-3 | 1-1 |
| Total Plays | 64 | 64 |
| Total Yards | 247 | 442 |
| Total Drives | 11 | 11 |
| Yards per Play | 3.9 | 6.9 |
| Passing | 183 | 270 |
| Comp/Att | 24/41 | 23/32 |
| Yards per pass | 4.3 | 8.2 |
| Interceptions thrown | 0 | 0 |
| Sacks-Yards Lost | 2-16 | 1-7 |
| Rushing | 64 | 172 |
| Rushing Attempts | 21 | 31 |
| Yards per rush | 3.0 | 5.5 |
| Red Zone (Made-Att) | 0-1 | 1-3 |
| Penalties | 3-15 | 7-73 |
| Turnovers | 0 | 0 |
| Fumbles lost | 0 | 0 |
| Interceptions thrown | 0 | 0 |
| Defensive / Special Teams TDs | 0 | 0 |
| Possession | 25:26 | 34:34 |
2025 Standings
National Football Conference
| NFC South | W | L | T | PCT | PF | PA |
|---|---|---|---|---|---|---|
| Carolina | 8 | 9 | 0 | .471 | 311 | 380 |
| Tampa Bay | 8 | 9 | 0 | .471 | 380 | 411 |
| Atlanta | 8 | 9 | 0 | .471 | 353 | 401 |
| New Orleans | 6 | 11 | 0 | .353 | 306 | 383 |
| NFC East | W | L | T | PCT | PF | PA |
|---|---|---|---|---|---|---|
| Philadelphia | 11 | 6 | 0 | .647 | 379 | 325 |
| Dallas | 7 | 9 | 1 | .441 | 471 | 511 |
| Washington | 5 | 12 | 0 | .294 | 356 | 451 |
| New York | 4 | 13 | 0 | .235 | 381 | 439 |
NFL News
Eagles' Saquon Barkley, family OK after attempted home burglary
Eagles running back Saquon Barkley and his family were unharmed after an attempted burglary of their home Saturday morning, according to the Tredyffrin Township Police Department.
11h
Where does Jets rookie QB Klubnik stand ahead of training camp?
New York's fourth-round pick has made a good impression on the coaching staff.
15h
NFL players love wearing their 'slippers and slides, baby!'
From Hulk slides to Hot Wheels slippers to therapeutic mules, NFL players focus on their feet off the field.
11h