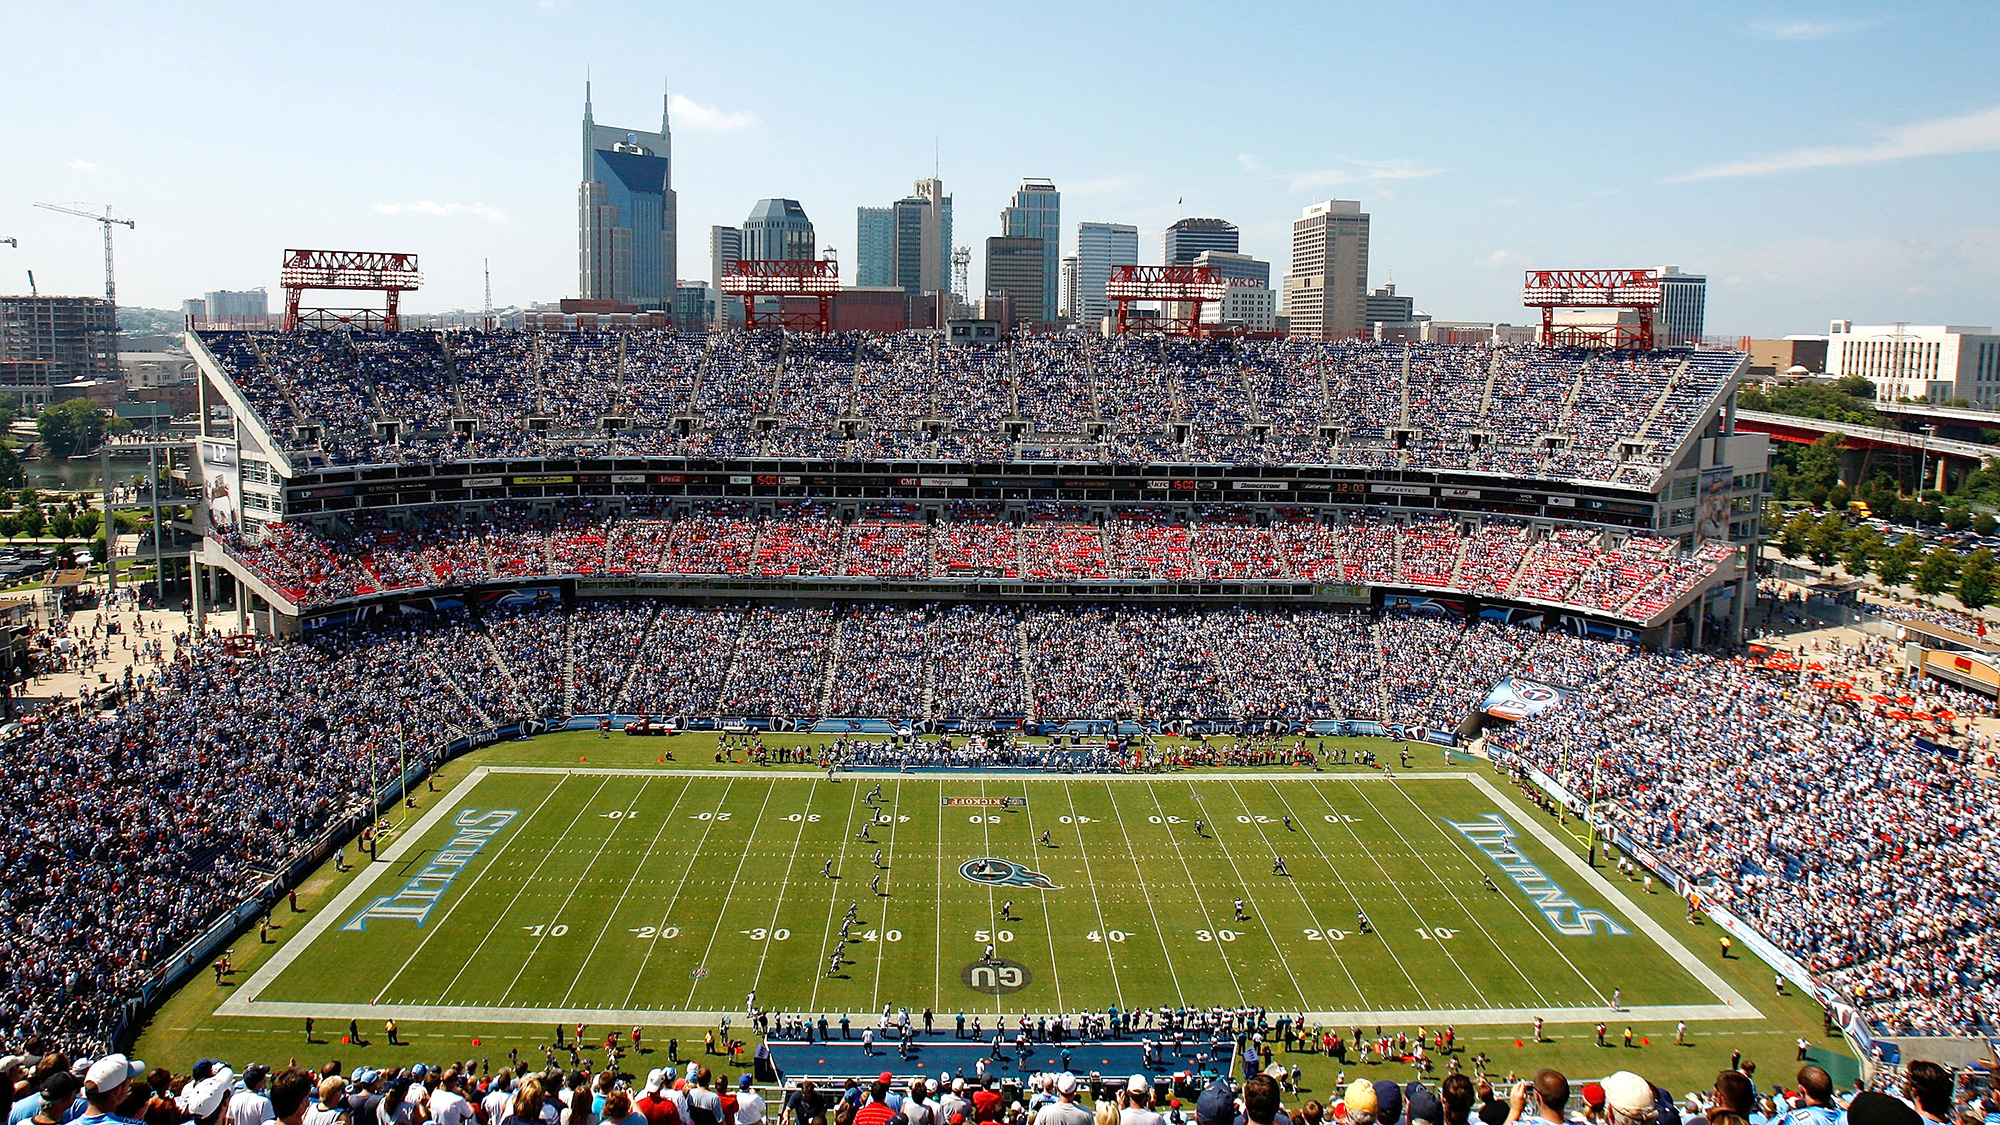
Detroit Lions @ Tennessee Titans
Game Leaders
Team Stats
583
Total Yards
437
1
Turnovers
2
36
1st Downs
21
10-91
Penalties
6-32
3/12
3rd Down
5/12
0/1
4th Down
0/0
0/0
Red Zone
0/0
40:36
Possession
27:49
Game Information
Nashville, TN


Team Stats
| 1st Downs | 36 | 21 |
| Passing 1st downs | 23 | 13 |
| Rushing 1st downs | 11 | 4 |
| 1st downs from penalties | 2 | 4 |
| 3rd down efficiency | 3-12 | 5-12 |
| 4th down efficiency | 0-1 | 0-0 |
| Total Plays | 92 | 61 |
| Total Yards | 583 | 437 |
| Total Drives | 14 | 13 |
| Yards per Play | 6.3 | 7.2 |
| Passing | 442 | 378 |
| Comp/Att | 43/55 | 29/42 |
| Yards per pass | 7.9 | 9.0 |
| Interceptions thrown | 0 | 0 |
| Sacks-Yards Lost | 1-8 | 0-0 |
| Rushing | 141 | 59 |
| Rushing Attempts | 36 | 19 |
| Yards per rush | 3.9 | 3.1 |
| Red Zone (Made-Att) | 0-0 | 0-0 |
| Penalties | 10-91 | 6-32 |
| Turnovers | 1 | 2 |
| Fumbles lost | 1 | 2 |
| Interceptions thrown | 0 | 0 |
| Defensive / Special Teams TDs | 0 | 4 |
| Possession | 40:36 | 27:49 |
2025 Standings
American Football Conference
| AFC South | W | L | T | PCT | PF | PA |
|---|---|---|---|---|---|---|
| Jacksonville | 13 | 4 | 0 | .765 | 474 | 336 |
| Houston | 12 | 5 | 0 | .706 | 404 | 295 |
| Indianapolis | 8 | 9 | 0 | .471 | 466 | 412 |
| Tennessee | 3 | 14 | 0 | .176 | 284 | 478 |
NFL News

How Mike Vrabel's ritual ignited the Patriots' Super Bowl run
High-fives, headlocks and full sprints: This is how the former All-Pro linebacker molded the franchise in his image.
3h

Super Bowl buzz: Latest on NFL free agency, trades, coaches
Here's what we heard this week in San Francisco on the Super Bowl teams, upcoming free agency, coaching moves and one intriguing trade candidate.
5h

Super Bowl 2026 commercials: Athletes include Serena, more
Breaking down the top commercials during Super Bowl LX that feature athletes.
5h
GAMBLING PROBLEM? CALL 1-800-GAMBLER, (800) 327-5050 or visit gamblinghelplinema.org (MA). Call 877-8-HOPENY/text HOPENY (467369) (NY). Please Gamble Responsibly. 888-789-7777/visit ccpg.org (CT), or visit www.mdgamblinghelp.org (MD). 21+ and present in most states. (18+ DC/KY/NH/WY). Void in ONT/OR/NH. Eligibility restrictions apply. On behalf of Boot Hill Casino & Resort (KS). Terms: sportsbook.draftkings.com/promos.
Copyright: © 2026 ESPN Enterprises, Inc. All rights reserved.


