
Miami Dolphins @ San Francisco 49ers

5-8, 2-5 Away
13
5-8, 2-5 Away

9-3-1, 5-1-1 Home
27
9-3-1, 5-1-1 Home
Game Leaders


150
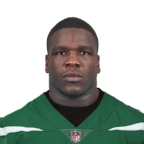
R. TannehillQB
17/33, 1 TD
150

185
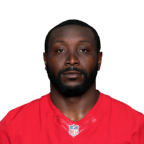
C. KaepernickQB
18/23
185

65
R. BushRB
14 CAR
65
63
F. GoreRB
12 CAR, 1 TD
63

50
D. BessWR
5 REC
50

93
M. CrabtreeWR
9 REC
93

3
C. WakeDE
3

2
A. SmithDE
2

12
K. DansbyLB
8 SOLO
12
7
N. BowmanLB
5 SOLO
7
Team Stats


227
Total Yards
321
1
Turnovers
0
17
1st Downs
20
5-43
Penalties
6-45
5/13
3rd Down
2/10
1/3
4th Down
0/0
0/0
Red Zone
0/0
29:28
Possession
30:32
Game Information
San Francisco, CA

Referee:Mike Carey
Team Stats
 | | |
|---|---|---|
| 1st Downs | 17 | 20 |
| Passing 1st downs | 9 | 9 |
| Rushing 1st downs | 5 | 9 |
| 1st downs from penalties | 3 | 2 |
| 3rd down efficiency | 5-13 | 2-10 |
| 4th down efficiency | 1-3 | 0-0 |
| Total Plays | 57 | 55 |
| Total Yards | 227 | 321 |
| Total Drives | 8 | 10 |
| Yards per Play | 4.0 | 5.8 |
| Passing | 133 | 166 |
| Comp/Att | 17/33 | 18/23 |
| Yards per pass | 3.8 | 6.1 |
| Interceptions thrown | 0 | 0 |
| Sacks-Yards Lost | 2-17 | 4-19 |
| Rushing | 94 | 155 |
| Rushing Attempts | 22 | 28 |
| Yards per rush | 4.3 | 5.5 |
| Red Zone (Made-Att) | 0-0 | 0-0 |
| Penalties | 5-43 | 6-45 |
| Turnovers | 1 | 0 |
| Fumbles lost | 1 | 0 |
| Interceptions thrown | 0 | 0 |
| Defensive / Special Teams TDs | 0 | 0 |
| Possession | 29:28 | 30:32 |
2025 Standings
American Football Conference
| AFC East | W | L | T | PCT | PF | PA |
|---|---|---|---|---|---|---|
| New England | 14 | 3 | 0 | .824 | 490 | 320 |
| Buffalo | 12 | 5 | 0 | .706 | 481 | 365 |
| Miami | 7 | 10 | 0 | .412 | 347 | 424 |
| New York | 3 | 14 | 0 | .176 | 300 | 503 |
National Football Conference
| NFC West | W | L | T | PCT | PF | PA |
|---|---|---|---|---|---|---|
| Seattle | 14 | 3 | 0 | .824 | 483 | 292 |
| Los Angeles | 12 | 5 | 0 | .706 | 518 | 346 |
| San Francisco | 12 | 5 | 0 | .706 | 437 | 371 |
| Arizona | 3 | 14 | 0 | .176 | 355 | 488 |
NFL News

Chiefs launch campaign for Kansas high school girls' flag football
The Kansas State High School Activities Association will have a vote on April 23 to determine if girls' high school flag football will be sanctioned.
2h

DeVonta Smith surprises Dan Orlovsky's son Madden with Eagles swag bag
Madden Orlovsky receives a "swag bag" from the Eagles' DeVonta Smith as "NFL Live" recognizes World Autism Awareness Day.
4h

Two-time All-Pro, 2019 DPOY Stephon Gilmore retires from NFL
Two-time All-Pro cornerback Stephon Gilmore announced his retirement from the NFL.
4h