
New York Giants @ Atlanta Falcons

8-6, 3-4 Away
0
8-6, 3-4 Away

12-2, 7-0 Home
34
12-2, 7-0 Home
Game Leaders


Team Stats


256
Total Yards
394
3
Turnovers
0
10
1st Downs
22
2-25
Penalties
3-30
4/10
3rd Down
9/13
0/3
4th Down
0/0
0/0
Red Zone
0/0
21:03
Possession
38:57
Game Information
Atlanta, GA
Referee:Bill Leavy
Team Stats
 | | |
|---|---|---|
| 1st Downs | 10 | 22 |
| Passing 1st downs | 5 | 16 |
| Rushing 1st downs | 4 | 6 |
| 1st downs from penalties | 1 | 0 |
| 3rd down efficiency | 4-10 | 9-13 |
| 4th down efficiency | 0-3 | 0-0 |
| Total Plays | 47 | 67 |
| Total Yards | 256 | 394 |
| Total Drives | 9 | 10 |
| Yards per Play | 5.4 | 5.9 |
| Passing | 159 | 265 |
| Comp/Att | 13/25 | 23/28 |
| Yards per pass | 6.1 | 9.1 |
| Interceptions thrown | 2 | 0 |
| Sacks-Yards Lost | 1-2 | 1-5 |
| Rushing | 97 | 129 |
| Rushing Attempts | 21 | 38 |
| Yards per rush | 4.6 | 3.4 |
| Red Zone (Made-Att) | 0-0 | 0-0 |
| Penalties | 2-25 | 3-30 |
| Turnovers | 3 | 0 |
| Fumbles lost | 1 | 0 |
| Interceptions thrown | 2 | 0 |
| Defensive / Special Teams TDs | 0 | 0 |
| Possession | 21:03 | 38:57 |
2025 Standings
National Football Conference
| NFC East | W | L | T | PCT | PF | PA |
|---|---|---|---|---|---|---|
| Philadelphia | 11 | 6 | 0 | .647 | 379 | 325 |
| Dallas | 7 | 9 | 1 | .441 | 471 | 511 |
| Washington | 5 | 12 | 0 | .294 | 356 | 451 |
| New York | 4 | 13 | 0 | .235 | 381 | 439 |
| NFC South | W | L | T | PCT | PF | PA |
|---|---|---|---|---|---|---|
| Carolina | 8 | 9 | 0 | .471 | 311 | 380 |
| Tampa Bay | 8 | 9 | 0 | .471 | 380 | 411 |
| Atlanta | 8 | 9 | 0 | .471 | 353 | 401 |
| New Orleans | 6 | 11 | 0 | .353 | 306 | 383 |
NFL News
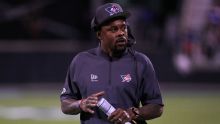
Ex-NFL WR Ted Ginn Jr. charged with DWI in Texas
Former NFL wide receiver and current Aviators coach Ted Ginn Jr. was charged with driving while intoxicated in Tarrant County, Texas, on Saturday.
16m

Emmanuel McNeil-Warren's NFL draft profile
Check out some of the top highlights from Toledo's Emmanuel McNeil-Warren.
2h
2026 NFL draft risers: Seven prospects climbing boards
Dillon Thieneman and Monroe Freeling have drastically boosted their stock since the start of last season. Who else has climbed the board?
5h