
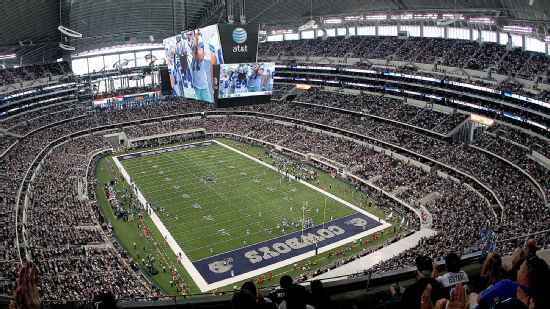
New York Jets @ Dallas Cowboys

9-5, 4-3 Away
19
9-5, 4-3 Away

4-10, 1-6 Home
16
4-10, 1-6 Home
Game Leaders


Team Stats


372
Total Yards
309
1
Turnovers
4
20
1st Downs
15
8-61
Penalties
6-54
5/14
3rd Down
2/11
0/1
4th Down
1/1
2/4
Red Zone
1/4
32:17
Possession
27:43
Game Information
Arlington, TX
Side Judge:Jeff Lamberth
Back Judge:Lee Dyer
Referee:Craig Wrolstad
Umpire:Roy Ellison
Field Judge:Steve Zimmer
Down Judge:Mark Hittner
Line Judge:Julian Mapp
Team Stats
 | | |
|---|---|---|
| 1st Downs | 20 | 15 |
| Passing 1st downs | 15 | 9 |
| Rushing 1st downs | 4 | 5 |
| 1st downs from penalties | 1 | 1 |
| 3rd down efficiency | 5-14 | 2-11 |
| 4th down efficiency | 0-1 | 1-1 |
| Total Plays | 67 | 56 |
| Total Yards | 372 | 309 |
| Total Drives | 13 | 12 |
| Yards per Play | 5.6 | 5.5 |
| Passing | 299 | 176 |
| Comp/Att | 26/39 | 18/33 |
| Yards per pass | 7.3 | 5.0 |
| Interceptions thrown | 1 | 4 |
| Sacks-Yards Lost | 2-0 | 2-19 |
| Rushing | 73 | 133 |
| Rushing Attempts | 26 | 21 |
| Yards per rush | 2.8 | 6.3 |
| Red Zone (Made-Att) | 2-4 | 1-4 |
| Penalties | 8-61 | 6-54 |
| Turnovers | 1 | 4 |
| Fumbles lost | 0 | 0 |
| Interceptions thrown | 1 | 4 |
| Defensive / Special Teams TDs | 0 | 0 |
| Possession | 32:17 | 27:43 |
2025 Standings
American Football Conference
| AFC East | W | L | T | PCT | PF | PA |
|---|---|---|---|---|---|---|
| New England | 14 | 3 | 0 | .824 | 490 | 320 |
| Buffalo | 12 | 5 | 0 | .706 | 481 | 365 |
| Miami | 7 | 10 | 0 | .412 | 347 | 424 |
| New York | 3 | 14 | 0 | .176 | 300 | 503 |
National Football Conference
| NFC East | W | L | T | PCT | PF | PA |
|---|---|---|---|---|---|---|
| Philadelphia | 11 | 6 | 0 | .647 | 379 | 325 |
| Dallas | 7 | 9 | 1 | .441 | 471 | 511 |
| Washington | 5 | 12 | 0 | .294 | 356 | 451 |
| New York | 4 | 13 | 0 | .235 | 381 | 439 |
NFL News

Amon-Ra St. Brown, longtime girlfriend Brooklyn Adams announce engagement
St. Brown proposed aboard a flower-lined yacht, with the couple sharing the news on social media.
9h

2026 Fantasy Football Draft Guide: Rankings, mock drafts and analysis
Your one-stop shop as you prep for draft season, including rankings, projections and analysis.
21h
Late Cowboys player Marshawn Kneeland diagnosed with CTE
Former Cowboys defensive end Marshawn Kneeland has been posthumously diagnosed with CTE.
20h