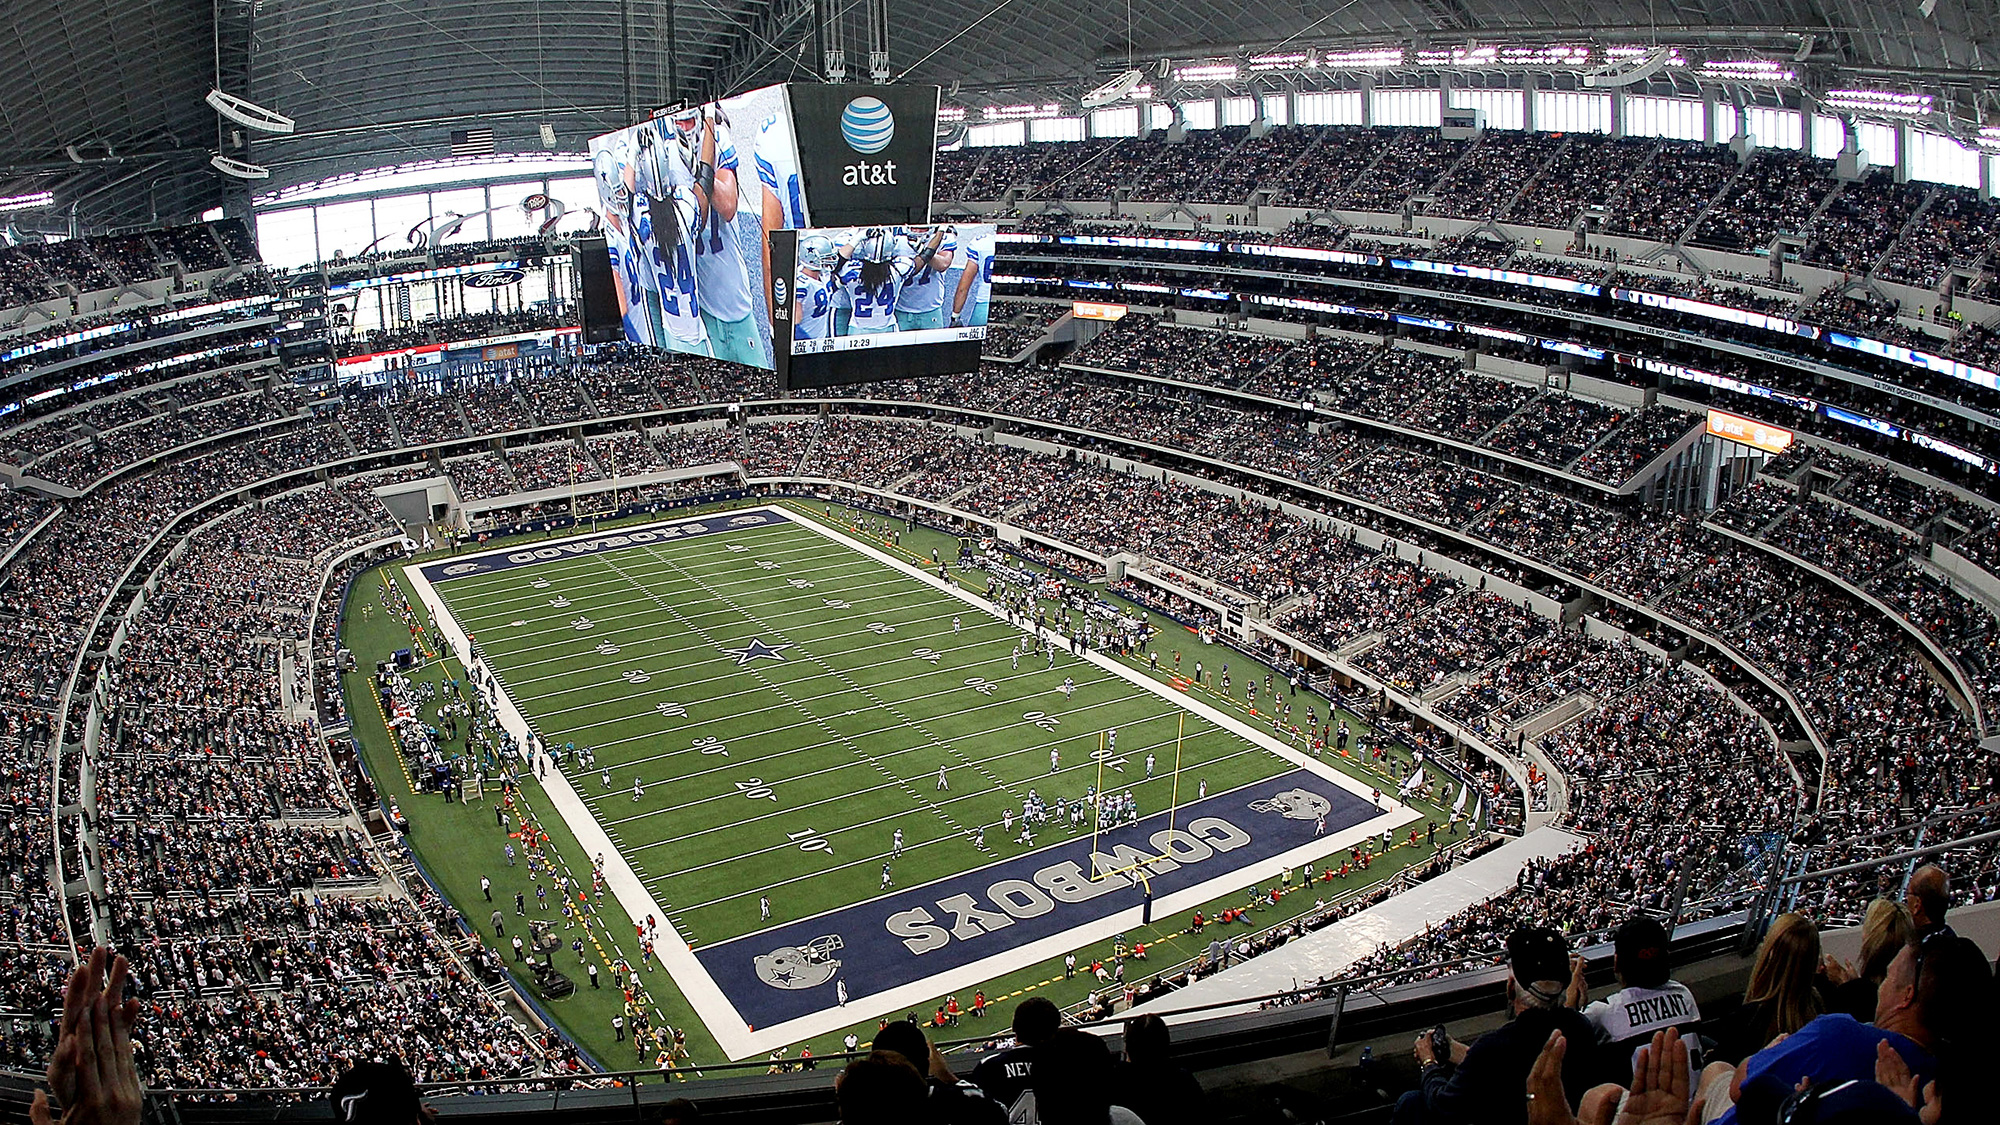
Seattle Seahawks @ Dallas Cowboys
Game Leaders

210
R. WilsonQB
19/30, 1 TD, 1 INT
210

97
M. CasselQB
13/25
97

71
M. LynchRB
21 CAR
71

64
D. McFaddenRB
20 CAR
64

75
J. GrahamTE
7 REC
75

49
D. McFaddenRB
6 REC
49

1
B. IrvinLB
1

--
--

9
K.J. WrightLB
6 SOLO
9

11
S. LeeLB
5 SOLO
11
Team Stats
323
Total Yards
220
1
Turnovers
0
19
1st Downs
14
5-40
Penalties
5-40
5/12
3rd Down
4/14
0/0
4th Down
1/2
0/2
Red Zone
0/3
29:38
Possession
30:22
Game Information
Arlington, TX

Referee:Carl Cheffers
Back Judge:Terrence Miles
Down Judge:Kent Payne
Line Judge:Tim Podraza
Umpire:Undrey Wash
Side Judge:Scott Novak
Field Judge:Brad Freeman

Team Stats
| 1st Downs | 19 | 14 |
| Passing 1st downs | 11 | 4 |
| Rushing 1st downs | 8 | 8 |
| 1st downs from penalties | 0 | 2 |
| 3rd down efficiency | 5-12 | 4-14 |
| 4th down efficiency | 0-0 | 1-2 |
| Total Plays | 61 | 57 |
| Total Yards | 323 | 220 |
| Total Drives | 10 | 10 |
| Yards per Play | 5.3 | 3.9 |
| Passing | 210 | 91 |
| Comp/Att | 19/30 | 13/26 |
| Yards per pass | 7.0 | 3.4 |
| Interceptions thrown | 1 | 0 |
| Sacks-Yards Lost | 0-0 | 1-6 |
| Rushing | 113 | 129 |
| Rushing Attempts | 31 | 30 |
| Yards per rush | 3.6 | 4.3 |
| Red Zone (Made-Att) | 0-2 | 0-3 |
| Penalties | 5-40 | 5-40 |
| Turnovers | 1 | 0 |
| Fumbles lost | 0 | 0 |
| Interceptions thrown | 1 | 0 |
| Defensive / Special Teams TDs | 0 | 0 |
| Possession | 29:38 | 30:22 |
SEA @ DAL Videos
Defensive efforts earn Sherman and Hardy game balls
- 1:17
2025 Standings
National Football Conference
| NFC West | W | L | T | PCT | PF | PA |
|---|---|---|---|---|---|---|
| Seattle | 14 | 3 | 0 | .824 | 483 | 292 |
| Los Angeles | 12 | 5 | 0 | .706 | 518 | 346 |
| San Francisco | 12 | 5 | 0 | .706 | 437 | 371 |
| Arizona | 3 | 14 | 0 | .176 | 355 | 488 |
| NFC East | W | L | T | PCT | PF | PA |
|---|---|---|---|---|---|---|
| Philadelphia | 11 | 6 | 0 | .647 | 379 | 325 |
| Dallas | 7 | 9 | 1 | .441 | 471 | 511 |
| Washington | 5 | 12 | 0 | .294 | 356 | 451 |
| New York | 4 | 13 | 0 | .235 | 381 | 439 |
NFL News

Seahawks OC Kubiak on Raiders reports: Focus is on Super Bowl
Asked about reports that he's expected to become the next head coach of the Raiders, Seahawks OC Klint Kubiak said his sole focus is on the Super Bowl.
8h

Super Bowl LX Patriots-Seahawks media day: Top quotes, moments, highlights
Before the Seattle Seahawks and New England Patriots take the field for Super Bowl LX, media day festivities took place on Monday.
10h

Cancer-free Terrell Williams happy to be with Patriots ahead of Super Bowl
A cancer-free Terrell Williams is now back with the Patriots for the Super Bowl on Sunday against the Seahawks.
10h
GAMBLING PROBLEM? CALL 1-800-GAMBLER, (800) 327-5050 or visit gamblinghelplinema.org (MA). Call 877-8-HOPENY/text HOPENY (467369) (NY). Please Gamble Responsibly. 888-789-7777/visit ccpg.org (CT), or visit www.mdgamblinghelp.org (MD). 21+ and present in most states. (18+ DC/KY/NH/WY). Void in ONT/OR/NH. Eligibility restrictions apply. On behalf of Boot Hill Casino & Resort (KS). Terms: sportsbook.draftkings.com/promos.
Copyright: © 2026 ESPN Enterprises, Inc. All rights reserved.


