Atlanta Falcons @ New Orleans Saints
Game Leaders

240
M. RyanQB
20/30, 2 TD
240

376
D. BreesQB
36/54, 3 TD, 1 INT
376

152
D. FreemanRB
14 CAR
152

77
M. Ingram IIRB
15 CAR
77

55
D. FreemanRB
5 REC, 1 TD
55

109
C. FleenerTE
7 REC, 1 TD
109

1
D. FreeneyDE
1

1.5
N. FairleyDT
1.5

10
S. WeatherspoonLB
8 SOLO
10

11
C. RobertsonLB
5 SOLO
11
Team Stats
442
Total Yards
474
0
Turnovers
2
26
1st Downs
32
4-35
Penalties
5-75
5/11
3rd Down
7/13
2/2
4th Down
1/2
5/7
Red Zone
4/5
27:26
Possession
32:34
Game Information
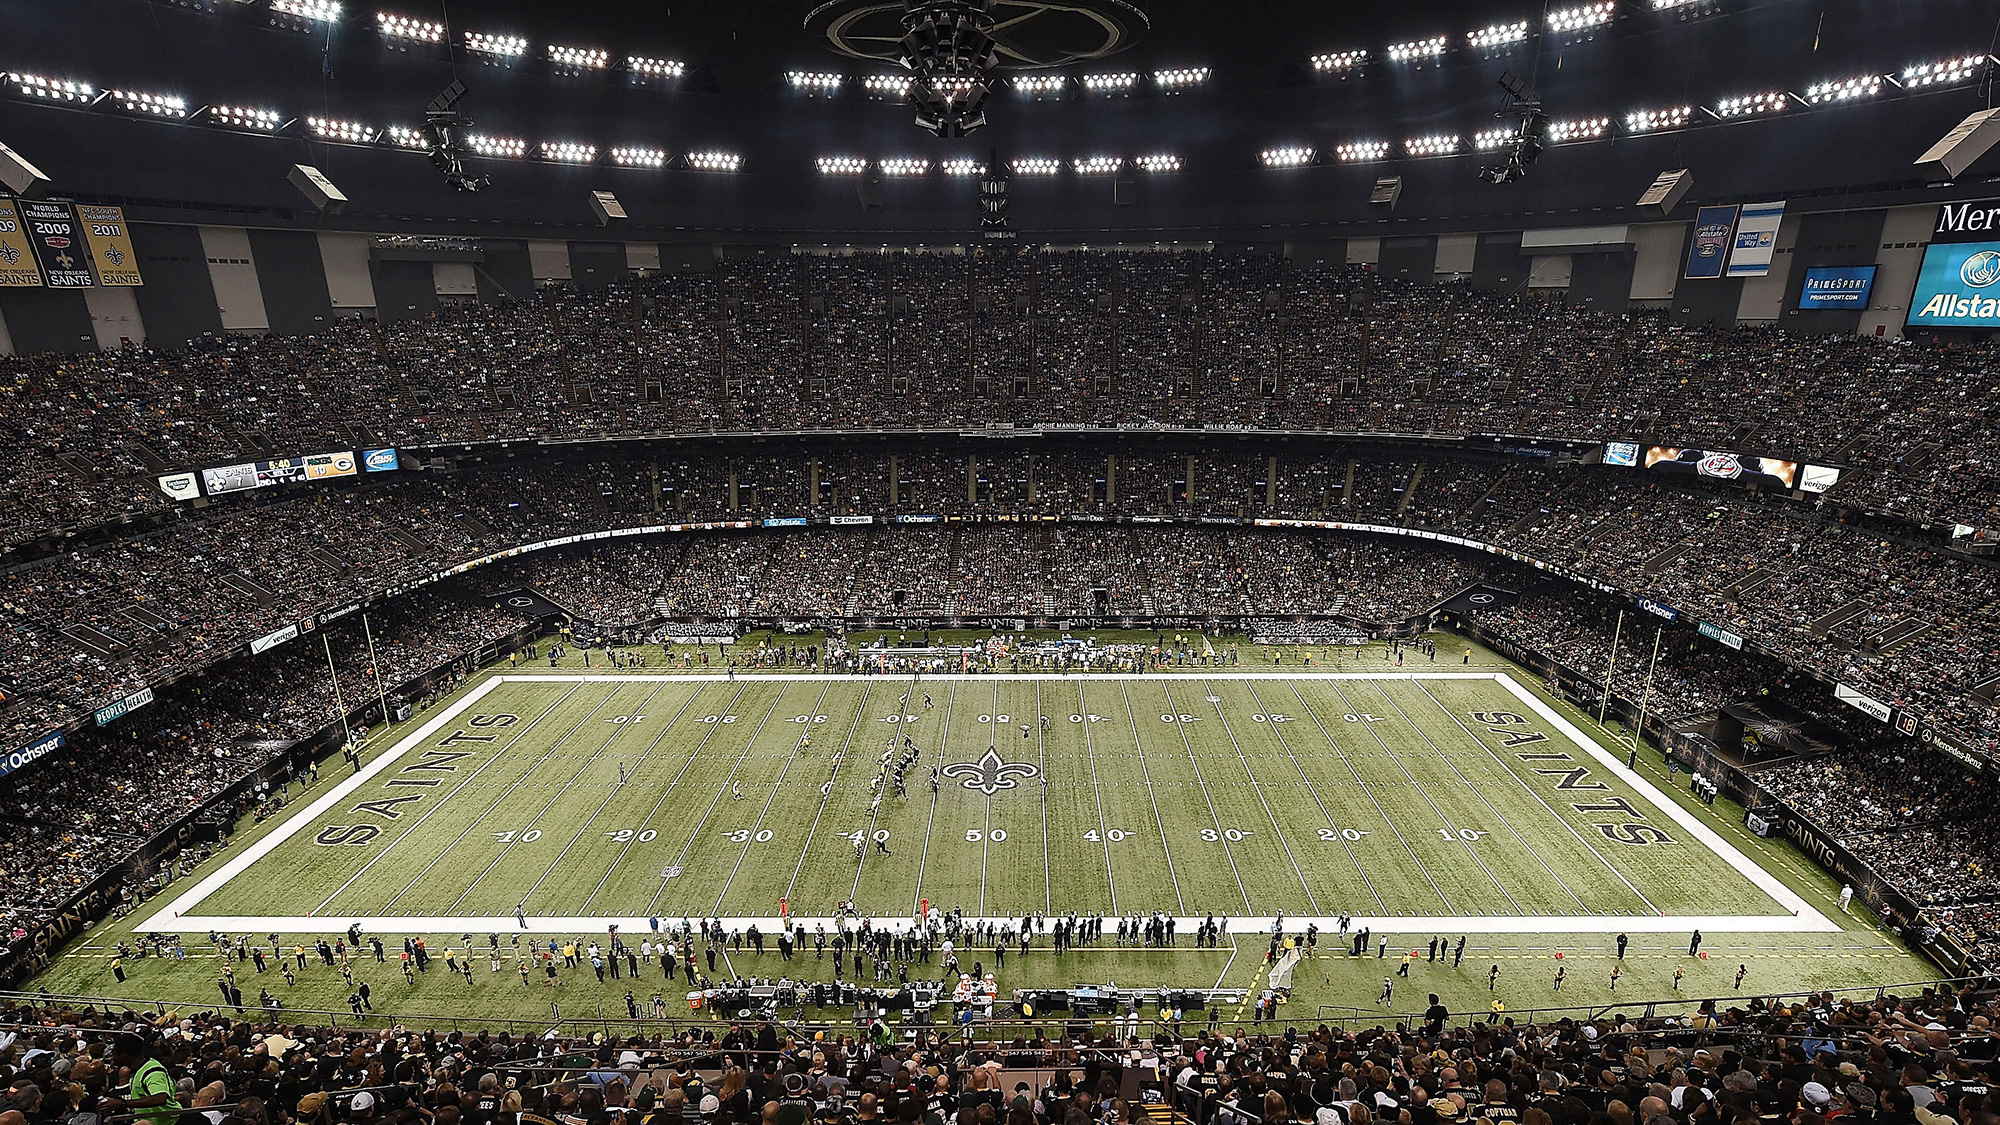
New Orleans, LA

Line Judge:Carl Johnson
Referee:Pete Morelli
Field Judge:Doug Rosenbaum
Down Judge:Steve Stelljes
Back Judge:Greg Steed
Side Judge:Boris Cheek
Umpire:Bryan Neale

Team Stats
| 1st Downs | 26 | 32 |
| Passing 1st downs | 13 | 21 |
| Rushing 1st downs | 11 | 9 |
| 1st downs from penalties | 2 | 2 |
| 3rd down efficiency | 5-11 | 7-13 |
| 4th down efficiency | 2-2 | 1-2 |
| Total Plays | 63 | 79 |
| Total Yards | 442 | 474 |
| Total Drives | 9 | 9 |
| Yards per Play | 7.0 | 6.0 |
| Passing | 225 | 359 |
| Comp/Att | 20/30 | 36/54 |
| Yards per pass | 7.0 | 6.4 |
| Interceptions thrown | 0 | 1 |
| Sacks-Yards Lost | 2-15 | 2-17 |
| Rushing | 217 | 115 |
| Rushing Attempts | 31 | 23 |
| Yards per rush | 7.0 | 5.0 |
| Red Zone (Made-Att) | 5-7 | 4-5 |
| Penalties | 4-35 | 5-75 |
| Turnovers | 0 | 2 |
| Fumbles lost | 0 | 1 |
| Interceptions thrown | 0 | 1 |
| Defensive / Special Teams TDs | 1 | 0 |
| Possession | 27:26 | 32:34 |
2025 Standings
National Football Conference
| NFC South | W | L | T | PCT | PF | PA |
|---|---|---|---|---|---|---|
| Carolina | 8 | 9 | 0 | .471 | 311 | 380 |
| Tampa Bay | 8 | 9 | 0 | .471 | 380 | 411 |
| Atlanta | 8 | 9 | 0 | .471 | 353 | 401 |
| New Orleans | 6 | 11 | 0 | .353 | 306 | 383 |
NFL News

Mailata on Stoutland: 'I was walking in SF just crying'
Philadelphia Eagles left tackle Jordan Mailata shares just how emotional it was getting the call that offensive line coach Jeff Stoutland was leaving the organisation.
4h

SEC representing in Super Bowl LX
SEC Now analysts take a look at all the SEC alumni participating in the Super Bowl and evaluate how they can make an impact.
5h

Players to win league MVP, Super Bowl MVP in the same season
Only seven NFL players have taken home league MVP and Super Bowl MVP honors in the same season. Check out top performers now.
5h
GAMBLING PROBLEM? CALL 1-800-GAMBLER, (800) 327-5050 or visit gamblinghelplinema.org (MA). Call 877-8-HOPENY/text HOPENY (467369) (NY). Please Gamble Responsibly. 888-789-7777/visit ccpg.org (CT), or visit www.mdgamblinghelp.org (MD). 21+ and present in most states. (18+ DC/KY/NH/WY). Void in ONT/OR/NH. Eligibility restrictions apply. On behalf of Boot Hill Casino & Resort (KS). Terms: sportsbook.draftkings.com/promos.
Copyright: © 2026 ESPN Enterprises, Inc. All rights reserved.


