
New England Patriots @ Houston Texans

9-2, 4-2 Away
23
9-2, 4-2 Away

4-7, 2-3 Home
20
4-7, 2-3 Home
Game Leaders


Team Stats


472
Total Yards
169
3
Turnovers
2
29
1st Downs
11
5-58
Penalties
6-45
7/20
3rd Down
5/15
2/3
4th Down
0/0
0/10
Red Zone
0/6
43:50
Possession
30:29
Game Information
Referee:Mike Carey
Team Stats
 | | |
|---|---|---|
| 1st Downs | 29 | 11 |
| Passing 1st downs | 20 | 7 |
| Rushing 1st downs | 7 | 3 |
| 1st downs from penalties | 2 | 1 |
| 3rd down efficiency | 7-20 | 5-15 |
| 4th down efficiency | 2-3 | 0-0 |
| Total Plays | 92 | 58 |
| Total Yards | 472 | 169 |
| Total Drives | 20 | 20 |
| Yards per Play | 5.1 | 2.9 |
| Passing | 344 | 80 |
| Comp/Att | 29/47 | 10/25 |
| Yards per pass | 6.7 | 2.9 |
| Interceptions thrown | 2 | 1 |
| Sacks-Yards Lost | 4-24 | 3-13 |
| Rushing | 128 | 89 |
| Rushing Attempts | 41 | 30 |
| Yards per rush | 3.1 | 3.0 |
| Red Zone (Made-Att) | 0-10 | 0-6 |
| Penalties | 5-58 | 6-45 |
| Turnovers | 3 | 2 |
| Fumbles lost | 1 | 1 |
| Interceptions thrown | 2 | 1 |
| Defensive / Special Teams TDs | 0 | 0 |
| Possession | 43:50 | 30:29 |
2025 Standings
American Football Conference
| AFC East | W | L | T | PCT | PF | PA |
|---|---|---|---|---|---|---|
| New England | 14 | 3 | 0 | .824 | 490 | 320 |
| Buffalo | 12 | 5 | 0 | .706 | 481 | 365 |
| Miami | 7 | 10 | 0 | .412 | 347 | 424 |
| New York | 3 | 14 | 0 | .176 | 300 | 503 |
| AFC South | W | L | T | PCT | PF | PA |
|---|---|---|---|---|---|---|
| Jacksonville | 13 | 4 | 0 | .765 | 474 | 336 |
| Houston | 12 | 5 | 0 | .706 | 404 | 295 |
| Indianapolis | 8 | 9 | 0 | .471 | 466 | 412 |
| Tennessee | 3 | 14 | 0 | .176 | 284 | 478 |
NFL News
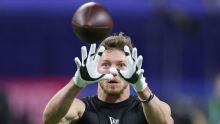
2026 NFL combine: Dillon Thieneman, Sonny Styles lead best photos
The NFL combine puts top prospects in front of countless cameras, and because they're sprinting full speed or lifting heavy weights, the result is often some hilariously intense facial expressions.
4h
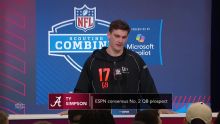
Why Ty Simpson feels he is a franchise quarterback
Ty Simpson speaks to the media at the NFL combine about proving himself as a franchise quarterback.
4h
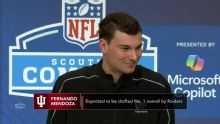
Mendoza speaks at the NFL combine: ‘I mean who hasn't admired Tom Brady?’
Projected No. 1 pick Fernando Mendoza speaks to the media at the NFL combine about the opportunity to work with Tom Brady if he goes to the Raiders.
4h