
Denver Broncos @ Tampa Bay Buccaneers

3-1, 1-1 Away
16
3-1, 1-1 Away
Final
| 1 | 2 | 3 | 4 | T | |
|---|---|---|---|---|---|
DEN | 7 | 6 | 0 | 3 | 16 |
| 0 | 10 | 3 | 0 | 13 |

0-4, 0-2 Home
13
0-4, 0-2 Home
Game Leaders


138
J. PlummerQB
13/30, 1 TD
138
162
B. JohnsonQB
15/23, 1 TD
162

66
Q. GriffinRB
21 CAR
66
72
M. PittmanRB
15 CAR
72
42
J. PutzierTE
2 REC
42

91
M. ClaytonWR
4 REC, 1 TD
91
1
W. MiddlebrooksDB
1
--
--
8
K. KennedySS
7 SOLO
8
11
S. QuarlesLB
6 SOLO
11
Team Stats


249
Total Yards
269
0
Turnovers
1
19
1st Downs
12
7-50
Penalties
9-97
8/17
3rd Down
4/11
0/0
4th Down
0/0
0/5
Red Zone
0/6
32:49
Possession
27:11
Game Information
Referee:Walt Coleman
Team Stats
 | | |
|---|---|---|
| 1st Downs | 19 | 12 |
| Passing 1st downs | 7 | 7 |
| Rushing 1st downs | 7 | 4 |
| 1st downs from penalties | 5 | 1 |
| 3rd down efficiency | 8-17 | 4-11 |
| 4th down efficiency | 0-0 | 0-0 |
| Total Plays | 65 | 49 |
| Total Yards | 249 | 269 |
| Total Drives | 12 | 14 |
| Yards per Play | 3.8 | 5.5 |
| Passing | 138 | 159 |
| Comp/Att | 13/30 | 15/24 |
| Yards per pass | 4.6 | 6.4 |
| Interceptions thrown | 0 | 0 |
| Sacks-Yards Lost | 0-0 | 1-3 |
| Rushing | 111 | 110 |
| Rushing Attempts | 35 | 24 |
| Yards per rush | 3.2 | 4.6 |
| Red Zone (Made-Att) | 0-5 | 0-6 |
| Penalties | 7-50 | 9-97 |
| Turnovers | 0 | 1 |
| Fumbles lost | 0 | 1 |
| Interceptions thrown | 0 | 0 |
| Defensive / Special Teams TDs | 0 | 0 |
| Possession | 32:49 | 27:11 |
2025 Standings
American Football Conference
| AFC West | W | L | T | PCT | PF | PA |
|---|---|---|---|---|---|---|
| Denver | 14 | 3 | 0 | .824 | 401 | 311 |
| Los Angeles | 11 | 6 | 0 | .647 | 368 | 340 |
| Kansas City | 6 | 11 | 0 | .353 | 362 | 328 |
| Las Vegas | 3 | 14 | 0 | .176 | 241 | 432 |
National Football Conference
| NFC South | W | L | T | PCT | PF | PA |
|---|---|---|---|---|---|---|
| Carolina | 8 | 9 | 0 | .471 | 311 | 380 |
| Tampa Bay | 8 | 9 | 0 | .471 | 380 | 411 |
| Atlanta | 8 | 9 | 0 | .471 | 353 | 401 |
| New Orleans | 6 | 11 | 0 | .353 | 306 | 383 |
NFL News
2026 NFL combine: Top draft prospects, best workouts, risers
Top prospects such as David Bailey and Ohio State's linebacker duo starred. Here are our experts on the combine's top workouts.
10h
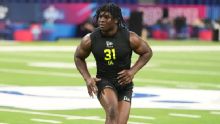
2026 NFL combine: Sonny Styles, Lee Hunter lead best photos
The NFL combine puts top prospects in front of countless cameras, and because they're sprinting full speed or lifting heavy weights, the result is often some hilariously intense facial expressions.
10h

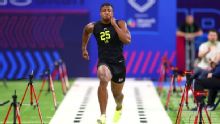
Ohio State LB Styles wows with 43.5-inch vertical at NFL combine
Projected top-10 pick Sonny Styles posted the best vertical jump by an off-ball linebacker at the combine since 2003 and also dazzled with a 4.46 time in the 40-yard dash and an 11-foot-2-inch broad jump Thursday.
12h