
Miami Dolphins @ Jacksonville Jaguars

7-6, 3-4 Away
14
7-6, 3-4 Away

7-6, 5-2 Home
10
7-6, 5-2 Home
Game Leaders


Team Stats


354
Total Yards
217
3
Turnovers
0
22
1st Downs
10
4-27
Penalties
2-10
8/15
3rd Down
3/14
1/1
4th Down
1/3
2/2
Red Zone
1/2
35:06
Possession
24:54
Game Information
Jacksonville, FL

Referee:Walt Coleman
Team Stats
 | | |
|---|---|---|
| 1st Downs | 22 | 10 |
| Passing 1st downs | 14 | 3 |
| Rushing 1st downs | 8 | 5 |
| 1st downs from penalties | 0 | 2 |
| 3rd down efficiency | 8-15 | 3-14 |
| 4th down efficiency | 1-1 | 1-3 |
| Total Plays | 71 | 54 |
| Total Yards | 354 | 217 |
| Total Drives | 12 | 12 |
| Yards per Play | 5.0 | 4.0 |
| Passing | 208 | 122 |
| Comp/Att | 21/29 | 11/26 |
| Yards per pass | 6.7 | 4.2 |
| Interceptions thrown | 1 | 0 |
| Sacks-Yards Lost | 2-12 | 3-17 |
| Rushing | 146 | 95 |
| Rushing Attempts | 40 | 25 |
| Yards per rush | 3.7 | 3.8 |
| Red Zone (Made-Att) | 2-2 | 1-2 |
| Penalties | 4-27 | 2-10 |
| Turnovers | 3 | 0 |
| Fumbles lost | 2 | 0 |
| Interceptions thrown | 1 | 0 |
| Defensive / Special Teams TDs | 0 | 0 |
| Possession | 35:06 | 24:54 |
2025 Standings
American Football Conference
| AFC East | W | L | T | PCT | PF | PA |
|---|---|---|---|---|---|---|
| New England | 14 | 3 | 0 | .824 | 490 | 320 |
| Buffalo | 12 | 5 | 0 | .706 | 481 | 365 |
| Miami | 7 | 10 | 0 | .412 | 347 | 424 |
| New York | 3 | 14 | 0 | .176 | 300 | 503 |
| AFC South | W | L | T | PCT | PF | PA |
|---|---|---|---|---|---|---|
| Jacksonville | 13 | 4 | 0 | .765 | 474 | 336 |
| Houston | 12 | 5 | 0 | .706 | 404 | 295 |
| Indianapolis | 8 | 9 | 0 | .471 | 466 | 412 |
| Tennessee | 3 | 14 | 0 | .176 | 284 | 478 |
NFL News
Source: Cowboys pass rusher Donovan Ezeiruaku has hip surgery
Cowboys pass rusher Donovan Ezeiruaku underwent hip surgery to repair a labrum tear five weeks ago, but he could be out until the start of training camp, according to a source.
6h
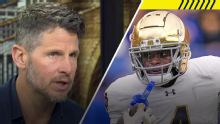
Orlovsky: Jeremiyah Love is the best player in the draft
Dan Orlovsky confidently declares Jeremiyah Love as the best player in the 2026 NFL draft.
6h

Texans trade starting RT Tytus Howard to Browns, source says
The Texans have agreed to trade starting right tackle Tytus Howard to the Browns for a fifth-round draft pick, a source told ESPN.
6h