
Kansas City Chiefs @ Indianapolis Colts

2-3, 1-2 Away
28
2-3, 1-2 Away

0-5, 0-3 Home
24
0-5, 0-3 Home
Game Leaders


257
M. CasselQB
21/29, 4 TD
257

277
C. PainterQB
15/27, 2 TD
277

119
J. BattleRB
19 CAR
119

38
D. BrownRB
8 CAR
38

128
D. BoweWR
7 REC, 2 TD
128
125
P. GarconWR
5 REC, 2 TD
125

--
--
1.5
D. FreeneyDE
1.5

8
D. JohnsonLB
3 SOLO
8

15
P. AngererLB
4 SOLO
15
Team Stats


436
Total Yards
355
0
Turnovers
0
26
1st Downs
15
5-39
Penalties
4-40
8/14
3rd Down
5/12
0/0
4th Down
0/1
3/3
Red Zone
2/2
33:07
Possession
26:53
Game Information
Indianapolis, IN
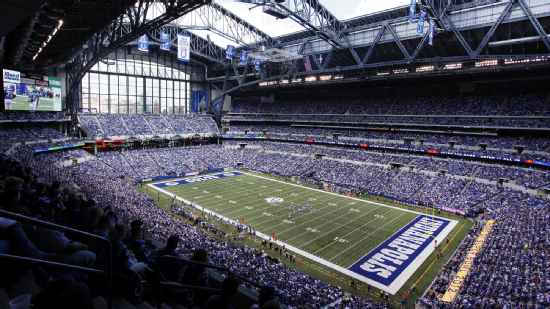
Referee:Carl Cheffers
Team Stats
 | | |
|---|---|---|
| 1st Downs | 26 | 15 |
| Passing 1st downs | 14 | 12 |
| Rushing 1st downs | 11 | 3 |
| 1st downs from penalties | 1 | 0 |
| 3rd down efficiency | 8-14 | 5-12 |
| 4th down efficiency | 0-0 | 0-1 |
| Total Plays | 69 | 54 |
| Total Yards | 436 | 355 |
| Total Drives | 11 | 11 |
| Yards per Play | 6.3 | 6.6 |
| Passing | 242 | 277 |
| Comp/Att | 21/29 | 15/27 |
| Yards per pass | 7.8 | 10.3 |
| Interceptions thrown | 0 | 0 |
| Sacks-Yards Lost | 2-15 | 0-0 |
| Rushing | 194 | 78 |
| Rushing Attempts | 38 | 27 |
| Yards per rush | 5.1 | 2.9 |
| Red Zone (Made-Att) | 3-3 | 2-2 |
| Penalties | 5-39 | 4-40 |
| Turnovers | 0 | 0 |
| Fumbles lost | 0 | 0 |
| Interceptions thrown | 0 | 0 |
| Defensive / Special Teams TDs | 0 | 0 |
| Possession | 33:07 | 26:53 |
2025 Standings
American Football Conference
| AFC West | W | L | T | PCT | PF | PA |
|---|---|---|---|---|---|---|
| Denver | 14 | 3 | 0 | .824 | 401 | 311 |
| Los Angeles | 11 | 6 | 0 | .647 | 368 | 340 |
| Kansas City | 6 | 11 | 0 | .353 | 362 | 328 |
| Las Vegas | 3 | 14 | 0 | .176 | 241 | 432 |
| AFC South | W | L | T | PCT | PF | PA |
|---|---|---|---|---|---|---|
| Jacksonville | 13 | 4 | 0 | .765 | 474 | 336 |
| Houston | 12 | 5 | 0 | .706 | 404 | 295 |
| Indianapolis | 8 | 9 | 0 | .471 | 466 | 412 |
| Tennessee | 3 | 14 | 0 | .176 | 284 | 478 |
NFL News
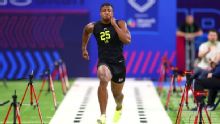
2026 NFL combine: Sonny Styles, Lee Hunter lead best photos
The NFL combine puts top prospects in front of countless cameras -- and because they're sprinting full speed or lifting heavy weights, the result is often some hilariously intense facial expressions.
3h

Ohio State LB Styles wows with 43.5-inch vertical at NFL combine
Projected top-10 pick Sonny Styles posted the best vertical jump by an off-ball linebacker at the combine since 2003 and also dazzled with a 4.46 time in the 40-yard dash and an 11-foot-2-inch broad jump Thursday.
3h

Source: Commanders release starting center Tyler Biadasz
The Commanders released starting center Tyler Biadasz, a source confirmed, freeing up more salary cap space but creating another need.
3h