
UAB Blazers @ Rice Owls

4-8, 1-5 Away
23
4-8, 1-5 Away

4-8, 3-4 Home
28
4-8, 3-4 Home
Game Leaders


248
B. EllisQB
21/39, 3 TD
248
125
T. McHargueQB
13/22, 1 TD
125
34
P. ShedRB
9 CAR
34
66
J. EddingtonTE
10 CAR, 2 TD
66
94
P. ShedRB
7 REC, 2 TD
94
53
P. RandolphWR
4 REC
53
1
B. TurnerDE
1
--
--
17
M. BurdetteLB
11 SOLO
17
8
J. HillLB
3 SOLO
8
Team Stats


350
Total Yards
354
0
Turnovers
1
16
1st Downs
25
9-95
Penalties
5-45
8/15
3rd Down
8/15
0/1
4th Down
1/1
15:29
Possession
21:11
Game Information
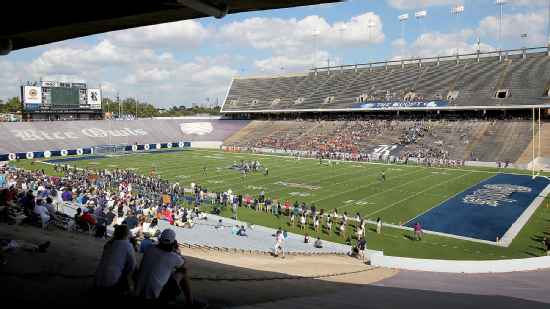
Houston, TX
Team Stats
 | | |
|---|---|---|
| 1st Downs | 16 | 25 |
| 3rd down efficiency | 8-15 | 8-15 |
| 4th down efficiency | 0-1 | 1-1 |
| Total Yards | 350 | 354 |
| Passing | 248 | 172 |
| Comp/Att | 21/39 | 15/26 |
| Yards per pass | 6.4 | 6.0 |
| Interceptions thrown | 0 | 1 |
| Rushing | 102 | 198 |
| Rushing Attempts | 21 | 51 |
| Yards per rush | 4.9 | 3.9 |
| Penalties | 9-95 | 5-45 |
| Turnovers | 0 | 1 |
| Fumbles lost | 0 | 0 |
| Interceptions thrown | 0 | 1 |
| Possession | 15:29 | 21:11 |
2025 Standings
FBS
| American Conference | CONF | OVR |
|---|---|---|
| Tulane | 7-1 | 11-3 |
| North Texas | 7-1 | 12-2 |
| Navy | 7-1 | 11-2 |
| East Carolina | 6-2 | 9-4 |
| South Florida | 6-2 | 9-4 |
| Army | 4-4 | 7-6 |
| Memphis | 4-4 | 8-5 |
| UTSA | 4-4 | 7-6 |
| Temple | 3-5 | 5-7 |
| Florida Atlantic | 3-5 | 4-8 |
| Rice | 2-6 | 5-8 |
| UAB | 2-6 | 4-8 |
| Tulsa | 1-7 | 4-8 |
| Charlotte | 0-8 | 1-11 |
NCAAF News

Key college football returning players for each top 25 team
With all the focus on the portal, we look at the most important players retained across college football.
11h

2026 NFL mock drafts: Latest ESPN player, team predictions
Here are our experts' NFL mock drafts for the 2026 cycle, including projected landing spots for all the top quarterbacks.
12h

2026 NFL mock draft: Mel Kiper's pick predictions for Round 1
As the NFL gets ready for this week's combine workouts, let's project where the best players in the 2026 NFL draft class will get picked in April.
8h