
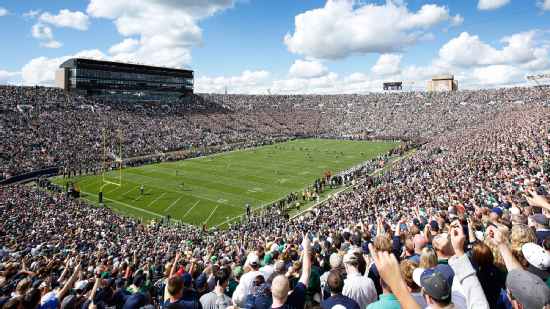
Navy Midshipmen @ Notre Dame Fighting Irish

4-1, 1-1 Away
24
4-1, 1-1 Away
Final
| 1 | 2 | 3 | 4 | T | |
|---|---|---|---|---|---|
NAVY | 7 | 14 | 3 | 0 | 24 |
| 7 | 17 | 14 | 3 | 41 |

5-1, 4-0 Home
41
5-1, 4-0 Home
Game Leaders


Team Stats


340
Total Yards
459
3
Turnovers
1
16
1st Downs
27
3-41
Penalties
4-35
2/11
3rd Down
7/12
4/4
4th Down
1/1
28:53
Possession
31:07
Game Information
Notre Dame, IN
Team Stats
 | | |
|---|---|---|
| 1st Downs | 16 | 27 |
| 3rd down efficiency | 2-11 | 7-12 |
| 4th down efficiency | 4-4 | 1-1 |
| Total Yards | 340 | 459 |
| Passing | 22 | 281 |
| Comp/Att | 3/6 | 22/31 |
| Yards per pass | 3.7 | 9.1 |
| Interceptions thrown | 1 | 1 |
| Rushing | 318 | 178 |
| Rushing Attempts | 49 | 40 |
| Yards per rush | 6.5 | 4.5 |
| Penalties | 3-41 | 4-35 |
| Turnovers | 3 | 1 |
| Fumbles lost | 2 | 0 |
| Interceptions thrown | 1 | 1 |
| Possession | 28:53 | 31:07 |
2025 Standings
FBS
| American Conference | CONF | OVR |
|---|---|---|
| Tulane | 7-1 | 11-3 |
| North Texas | 7-1 | 12-2 |
| Navy | 7-1 | 11-2 |
| East Carolina | 6-2 | 9-4 |
| South Florida | 6-2 | 9-4 |
| Army | 4-4 | 7-6 |
| Memphis | 4-4 | 8-5 |
| UTSA | 4-4 | 7-6 |
| Temple | 3-5 | 5-7 |
| Florida Atlantic | 3-5 | 4-8 |
| Rice | 2-6 | 5-8 |
| UAB | 2-6 | 4-8 |
| Tulsa | 1-7 | 4-8 |
| Charlotte | 0-8 | 1-11 |
FBS
| FBS Independents | CONF | OVR |
|---|---|---|
| Notre Dame | 0-0 | 10-2 |
| UConn | 0-0 | 9-4 |
NCAAF News

Which colleges have produced Super Bowl starting QBs?
The California Golden Bears have produced the most Super Bowl starting quarterbacks in history. See which other schools join them on the list.
8h

Sources: North Dakota State joins Mountain West for football
FCS powerhouse North Dakota State has finalized an agreement to join the Mountain West Conference in football only starting in 2026, sources told ESPN.
14h

What If?: Imagine these legends with one more year of eligibility
Marty & McGee imagine which stars would dominate with another year of eligibility, led by Tennessee legend Heath Shuler and a list that spans Randy Moss to Michael Jordan.
2d